Experiment Tracking Essentials: Finding the Right Tool
Gradio’s Custom Dashboards vs Wandb’s Built-In Tools for Training Diffusion Models
Hi there, I am Anca, a software engineer passionate about ML, Quantum Computing and Formula 1.
This tutorial will guide you through the essentials of Diffusion Models, show you how to monitor your experiments with Wandb or Gradio, and help you choose the right tools for your projects.

Running experiments without tracking tools is like sailing without a compass—you might reach a destination, but is it the right one?
Tracking is crucial in any research workflow, especially in machine learning and data science, as it ensures reproducibility, provides clarity, and facilitates collaboration.
However, researchers often face challenges like managing large volumes of data, maintaining consistency, and visualizing complex results.
How Do You Choose the Best Tracking Tool?
With so many tools available, finding the right one can feel overwhelming. The challenge lies in discovering a tool that strikes the perfect balance—one that's intuitive to use but powerful enough to provide deep insights.
Why Are Diffusion Models Ideal for Showcasing the Use of Tracking Tools?
Diffusion models, while known for generating high-quality images, come with several unique challenges during training:
Complex Metrics: These models require sophisticated metrics for accurate performance measurement, which can often be unstable.
Close Monitoring Needed: The training process demands careful monitoring because even small changes can significantly impact the final image quality.
Longer Training Times: Diffusion models typically require extended training periods, making the process more time-consuming.
Careful Adjustments: Precise tuning of settings is essential, as any misstep can lead to suboptimal results.
Without efficient tracking tools, managing these challenges becomes difficult, leading to poor outcomes and issues with reproducibility.
With these complexities in mind, diffusion models serve as an excellent example of why reliable tracking tools are essential.
How Will We Demonstrate Effective Tracking?
To demonstrate effective tracking, we'll use two Python notebooks that showcase the use of Wandb and Gradio for tracking the training of a diffusion model.
Access the Python Notebooks directly in Google Colab:
Table of Contents:
Basics of Diffusion Models
Wandb’s Built-In Tools
Custom Dashboards with Gradio
Wandb vs Gradio for Experimental Tracking
Basics of Diffusion Models
Diffusion models are probabilistic generative models that gradually add noise to data and then learn to reverse this process to generate new, realistic samples, making them ideal for tasks like image generation, audio synthesis, text-to-image generation, and super-resolution.
The Diffusion Process typically involves:
Forward Process: Data is incrementally corrupted with noise, resulting in increasingly noisy versions until it becomes pure noise.
Reverse Process: A neural network, often based on U-Net architecture, reverses this noise step by step, gradually restoring the original data.
Check out an overview of the Diffusion Process in the following diagram:
Setting Up and Training a Diffusion Model
Now that we have the basics of the Diffusion Process laid out, how can we set up our own Training Pipeline?
Install Necessary Libraries and Define Settings:
Install the required packages, including the
diffuserspackage from Hugging Face.!pip install -q -U diffusers==0.30.0 …Define the key settings and parameters needed for the training process.
@dataclass
class TrainingConfig:
    train_batch_size: int = 16
    … rest of training parameters
Load, Visualize, and Preprocess Dataset:
Load the butterfly image dataset, visualize the first few images, and ensure the data is correctly formatted.
dataset = load_dataset(config.dataset_name, split="train")
fig, axs = plt.subplots(1, 4, figsize=(16, 4))
for i, image in enumerate(dataset[:4]["image"]):
    axs[i].imshow(image)
    axs[i].set_axis_off()
fig.show()
Set up a preprocessing pipeline to resize images, apply data augmentation, and prepare them for training.
preprocess = transforms.Compose(
    [transforms.Resize((config.image_size, config.image_size)),
     ... rest of operations])
Select Reference Images:
Choose the first 16 images from the dataset to serve as reference images for FID score computation.
images = dataset.select(range(16))
save_grid_image(images,...)
Set Up Noise Addition and Training Components:
Define a function to add noise to images, simulating the diffusion process.
noise = torch.randn(...)
noisy_images = noise_scheduler.add_noise(images, noise, timesteps)
Configure the DataLoader, set up the UNet model, and prepare the optimizer and learning rate scheduler.
train_dataloader = torch.utils.data.DataLoader(..)
model = UNet2DModel(...)
optimizer = torch.optim.AdamW(...)
lr_scheduler = get_cosine_schedule_with_warmup(...)
Implement Evaluation Function and Main Training Loop:
Create a function to assess model performance by generating images and calculating the FID score.
generated_images = pipeline(…).images
save_grid_image(generated_images, generated_images_dir,...)
fid_value = fid_score.calculate_fid_given_paths(
    [reference_images_dir, generated_image_dir],  ….)
track_metrics_per_epoch(fid_value,epoch)
Set up and execute the main training loop using the
Acceleratelibraryaccelerator = Accelerator(…) model, optimizer, dataloader, lr_sched = accelerator.prepare(…)
Wandb’s Built-In Tools
Weights & Biases (Wandb) is a powerful tool for tracking and managing machine learning experiments. It helps you monitor experiments in real-time, compare runs, and collaborate easily.
Key Features of Wandb:
Live Metric Tracking: Monitor training metrics in real-time.
Easy Integration: Works well with frameworks like TensorFlow and PyTorch.
User-Friendly Dashboard: Clear and interactive visualizations of training progress.
Run Comparisons and Tuning: Compare runs and optimize hyperparameters.
Wandb is especially useful in deep learning research, like image classification and natural language processing, where tracking complex models and multiple hyperparameters is important.
Using Wandb's Built-In Tools for Experiment Tracking
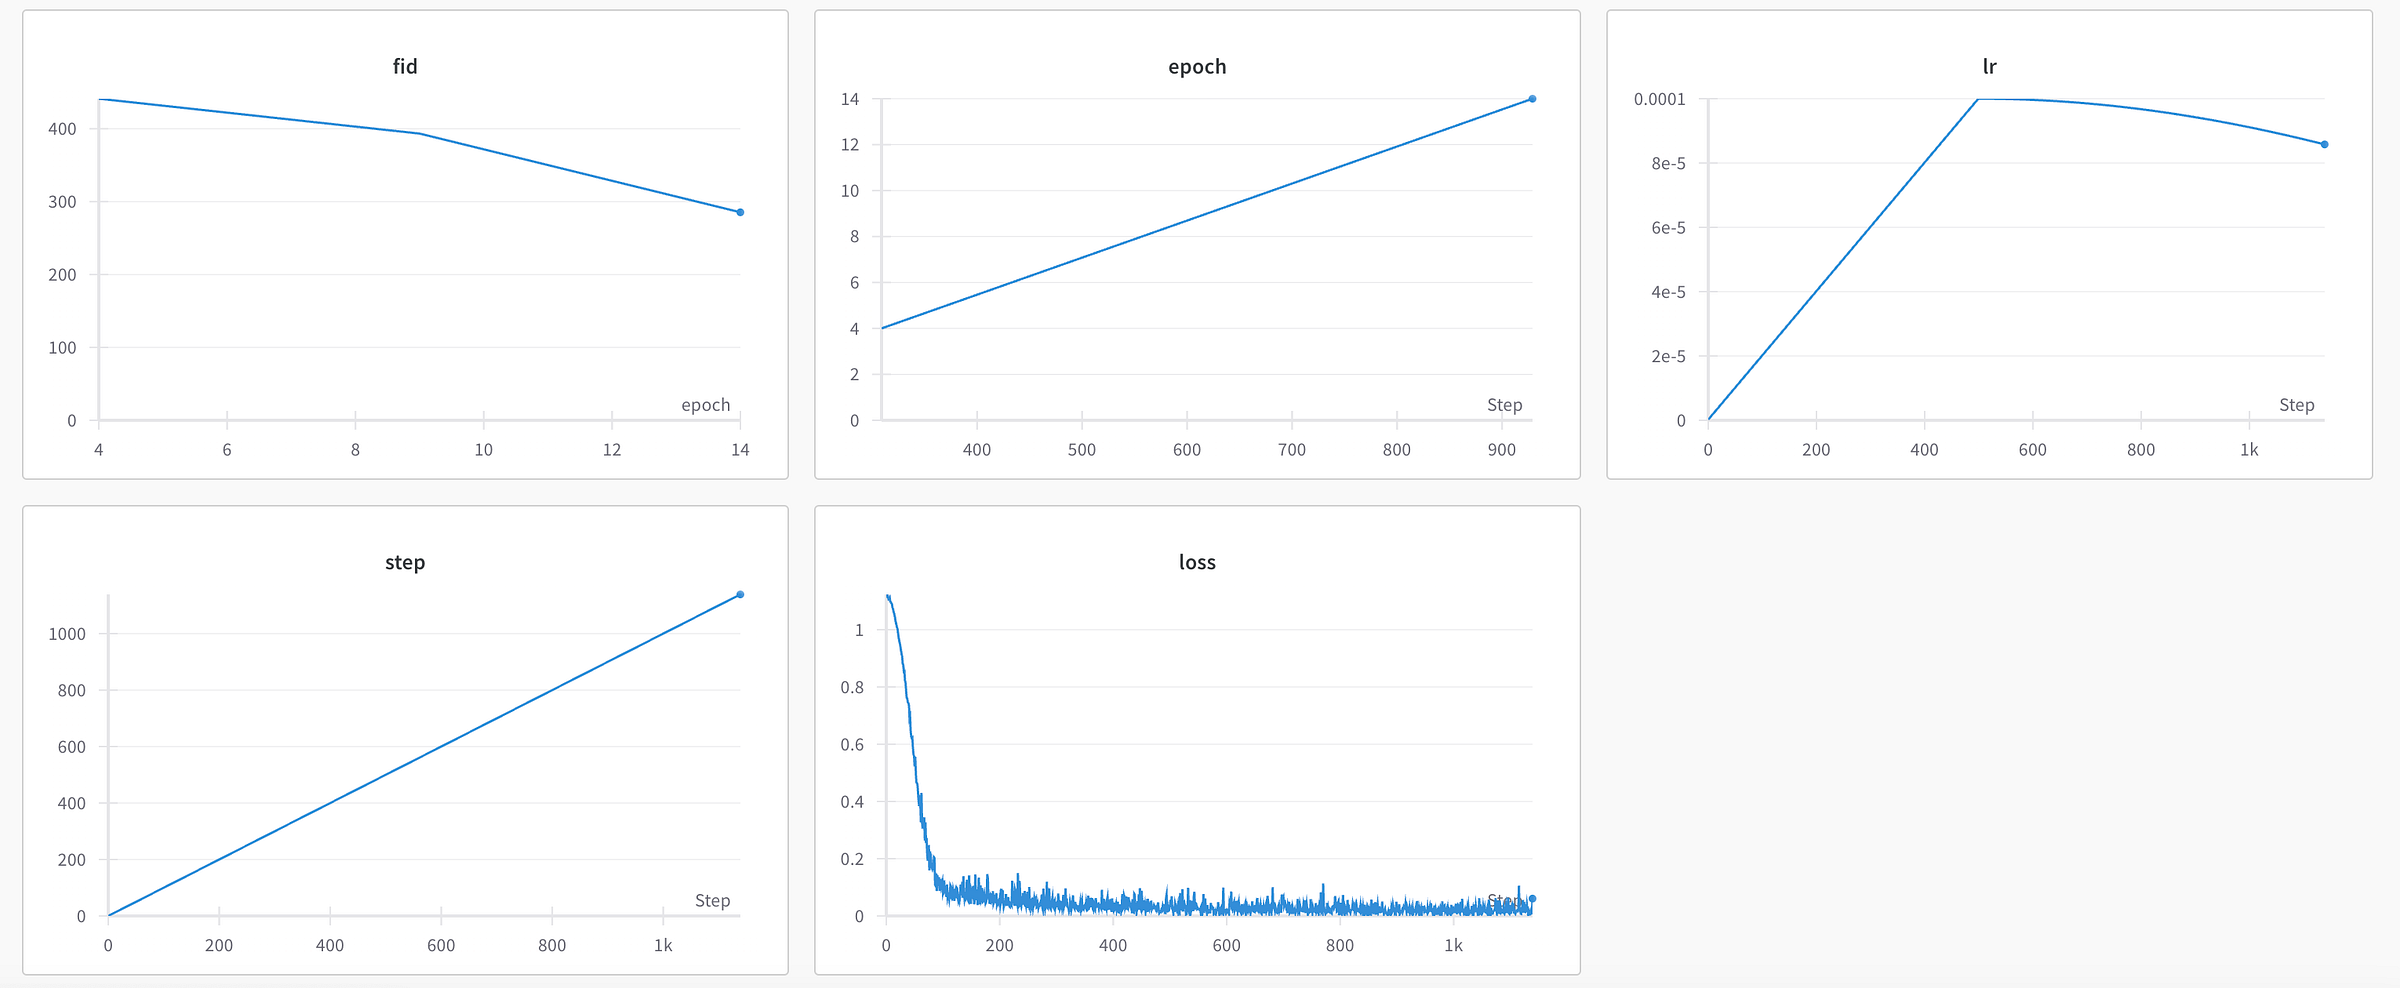
Want to see your diffusion model’s performance evolve in real-time?
Building a dashboard like this is actually quite simple, especially with the tools Wandb provides. Let me take you through the process:
Install Wandb Library:
Start by installing the Wandb Python library to enable seamless experiment tracking.
!pip install -q -U wandb==0.17.7
Set Up Environment Variables:
Configure the necessary environment variables and set up the logger to integrate Wandb with the Accelerate library.
os.environ["WANDB_API_KEY"] = "<PLACE_YOUR_API_KEY>"
os.environ["WANDB_INIT_TIMEOUT"] ="300"
config.logger_name = "wandb"
Log Key Metrics:
Define methods to log important metrics like FID, loss, and learning rate during training. This helps track the model's performance over time.
logs = {"fid": fid_value, "epoch": epoch}
wandb.log(logs)
Set Up and Log Custom Metrics:
If using custom metrics like the FID score, define and configure them in Wandb. Specify how these metrics should be tracked, such as using epochs instead of individual training steps. Ensure this is done after initializing the project in Wandb.
wandb.define_metric("epoch")
wandb.define_metric("fid", step_metric="epoch")
Custom Dashboards with Gradio
Gradio is a straightforward tool that simplifies creating and sharing interactive interfaces for machine learning models. Whether you’re quickly prototyping or showcasing your model, Gradio allows you to build custom web interfaces with ease.
Key Features of Gradio:
No Frontend Code Interface Building: Create interactive model interfaces without needing any frontend coding knowledge or writing complex web code.
Instant Deployment: Launch and share your model interface quickly.
Flexible Input/Output Options: Supports diverse inputs like images, text, audio, and video, with customizable outputs.
Interactive Testing: Users can test models with their own data directly through the interface.
Setting up a Custom Dashboard in Gradio
Do you want complete control over how you monitor your research, with everything you need in one customizable dashboard?
Putting together a dashboard like this is straightforward, thanks to Gradio's user-friendly interface. Here's how you can do it:
Install Gradio Library:
Start by installing the Gradio Python library to enable the creation of interactive dashboards.
!pip install -q -U gradio==4.41.0
Set Up Metric Tracking:
Define tracking methods that append metric values (like FID score, learning rate, and loss) to lists that Gradio will use for real-time updates on the dashboard.
loss_values.append(metrics["loss"])
Create Functions for Visualizing Metrics:
Develop functions to generate line plots for key metrics, such as learning rate, loss, and FID score.
data = pd.DataFrame({"Steps": steps,"Loss": loss_values})
plot = gr.LinePlot(value=data, x="Steps", y="Loss")
Design the Gradio Interface:
Arrange the interface into rows with sections dedicated to line plots for metrics and grids for reference and generated images. Adjust the update intervals for the plots, ensuring they refresh regularly.
with gr.Row():
  fid_plot = gr.LinePlot()
demo.load(get_fid_plot, None, fid_plot, every=5)
Launch the Gradio Interface:
Run the Gradio interface, providing real-time monitoring and visualization of the model’s training process.
demo.launch()
Wandb vs. Gradio for Experimental Tracking
Here is a breakdown of Wandb vs. Gradio comparison across 4 key criteria:
Efficiency:
When it comes to tracking and logging experiments over time, Wandb shines. It’s built for long-term, detailed monitoring with minimal setup.
Gradio, on the other hand, is your go-to for quickly deploying interactive interfaces but requires extra steps for tracking data on multiple runs.
Flexibility:
If customization is key, Gradio offers unparalleled flexibility. You can easily tailor interfaces to fit your exact needs, making it perfect for real-time data visualization.
While Wandb is robust in metric tracking it doesn’t offer the same level of interface customization.
User Experience:
Wandb is easy to pick up for basic tasks, though its more advanced features might take some time to master.
Gradio is great for creating demos with ease, but understanding the mechanisms behind their live updates strategy can be a bit tricky for beginners.
Collaboration:
For team projects, Wandb is incredibly effective, making it easy to share and manage experiments across your team.
Gradio, on the other hand, excels at sharing interactive demos, making it perfect for gathering feedback from both technical and non-technical audiences.
Recommendations
Use Wandb if your focus is on detailed experiment tracking and effective team collaboration.
Choose Gradio if you need to create and share interactive model interfaces quickly.
Consider combining both for a well-rounded solution that brings together Wandb's robust tracking and Gradio's interactive presentation.
This post covered:
Setting up your Diffusion Model Training
Using Wandb’s Experimental Tracking Features
Creating a Custom Dashboard in Gradio
Wandb vs Gradio
Next steps
For more details on diffusion models, W&B, and Gradio, check out the full article:
To try out the code yourself, check out the complete code:
Images
If not otherwise stated, all images are created by the author.


