Real-time model serving is an aspect of MLOps that most machine learning teams still struggle with. Often, the deployment part is outsourced to the DevOps team, and the machine learning team is responsible for the model training and handing over the model artifact. This split of responsibilities (especially if teams have different targets) is not ideal: changes in the model training code would mean that the deployment part also needs to be adjusted, which requires a lot of coordination between the teams.
Mehmet Acikgoz is a Program contributor at Marvelous MLOps, helping with the course curriculum.
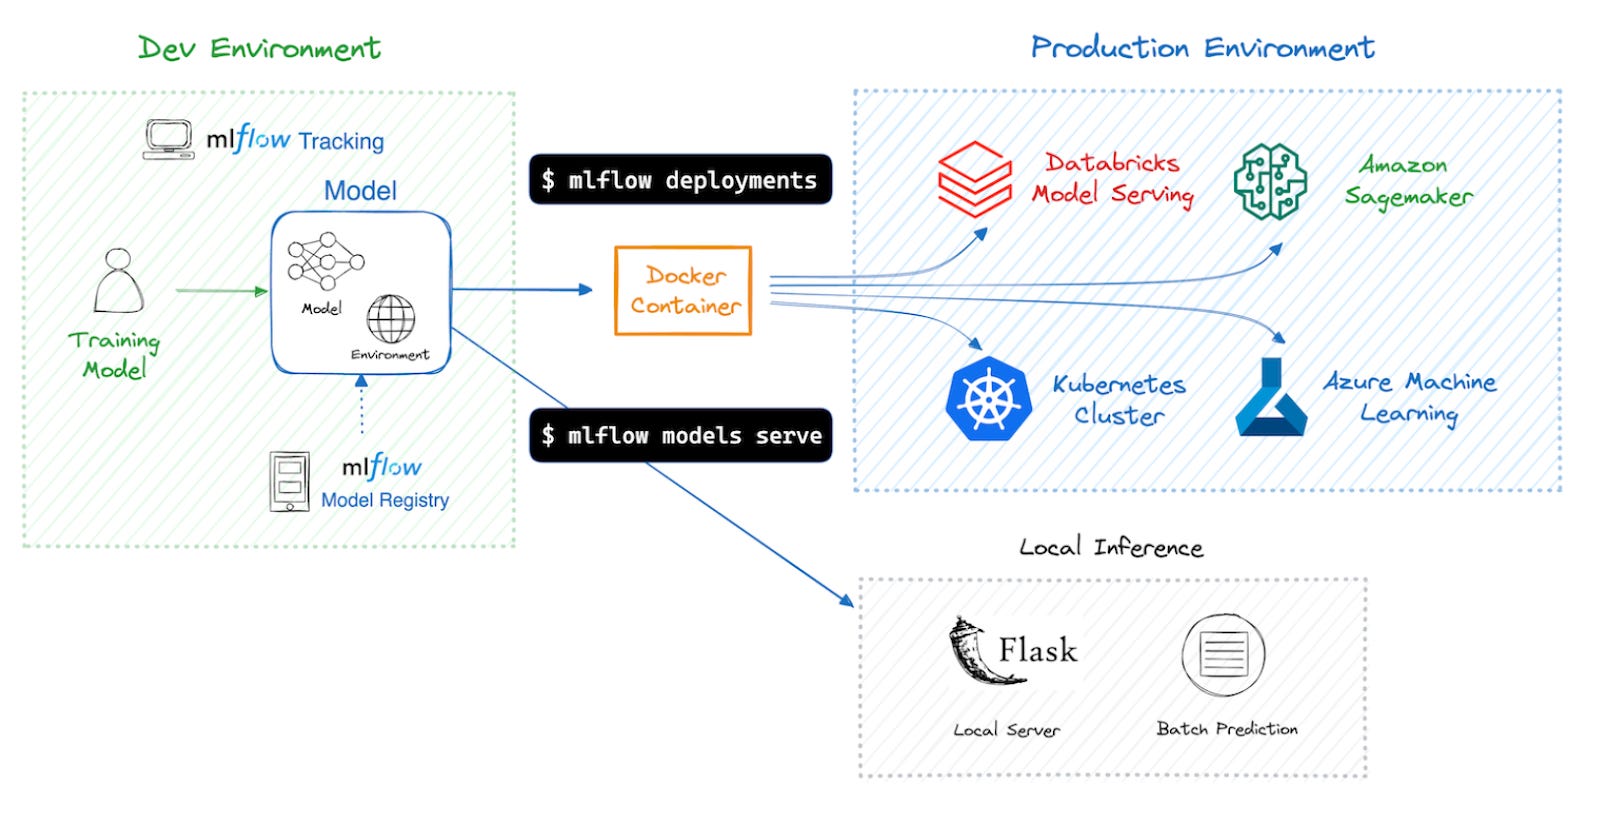
We believe that the machine learning teams should be responsible for machine learning model deployment end-to-end. However, they often lack the skills, especially when it comes to the real-time model serving. Luckily, there are tools that aim to simplify that part of the deployment, if you are a Databricks user. Databricks model serving is worth considering for that purpose: models can be deployed with minimal code using Python SDK, given that the model training is tracked using MLflow and registered in Unity Catalog.
It all sounds simple, but has a downside: if something is wrong with your deployment (especially if you are using a custom model), you will only see it after you have waited for 15-20 minutes. Very time-consuming (and expensive) interaction cycle… But it does not have to be that way! Databricks model serving utilizes MLflow model serving, which means, you can also test it locally.
In this article, we’ll demonstrate the local testing workflow using the well-known Iris-Species dataset, focusing on three critical steps:
Download a pyfunc model artifact from MLflow experiment tracking.
Deploy the model endpoint locally.
Test the endpoint.
Before we proceed with these steps, let’s walk through the prerequisites and code we used to train the Iris model and log it in MLflow.
Prerequisites
First of all, make sure you have Databricks CLI installed. Follow the instructions if it is not the case. Authenticate to your Databricks workspace. As a result, you will have a .databrickscfg file with a profile.
Clone the repository, and set up your virtual environment with all the dependencies by running the following command:
uv sync –-all-extras
Model training & MLflow experiment tracking
First of all, we get the data and train the sklearn pipeline to predict the Iris species.
from sklearn.compose import ColumnTransformer
from sklearn.pipeline import Pipeline
from sklearn.preprocessing import StandardScaler
from sklearn.model_selection import train_test_split


iris = datasets.load_iris(as_frame=True)
X = iris.data
y = iris.target
logger.info("The dataset is loaded.")


X_train, X_test, y_train, y_test = train_test_split(X, y, test_size=0.2, random_state=28)
preprocessor = ColumnTransformer(
               transformers=[("std_scaler", StandardScaler(), iris.feature_names)])


pipeline = Pipeline(steps=[("preprocessor", preprocessor),
                          ("classifier", LogisticRegression()),
                          ])
pipeline.fit(X_train, y_train)
After that, we define a custom model wrapper:
import pandas as pd
import numpy as np
from typing import Union
from mlflow.pyfunc import PythonModelContext


class ModelWrapper(mlflow.pyfunc.PythonModel):
   def __init__(self, model: object) -> None:
       self.model = model
       self.class_names = iris.target_names


   def predict(
       self,
       context: PythonModelContext,
       model_input: Union[pd.DataFrame, np.array],
   ) -> Union[pd.DataFrame, np.ndarray]:
       raw_predictions = self.model.predict(model_input)
       mapped_predictions = [self.class_names[int(pred)] for pred in raw_predictions]
       return mapped_predictions
This model wrapper is pretty basic: the only thing we change is that the pipeline outputs the name of the iris species instead of a number. Of course, you can put any logic in such a wrapper class and make it more complex.
Finally, we log the model together with some metrics and parameters. It is important to specify the profile in the MLflow tracking URI (it is the same as the profile name in the .databrickscfg file).
import mlflow
from loguru import logger
from mlflow.models import infer_signature

mlflow.autolog(disable=True)
# mlflow.set_tracking_uri(“databricks://your-profile”) - use it to run locally
mlflow.set_tracking_uri("databricks")
mlflow.set_experiment("/Shared/iris-demo")


with mlflow.start_run() as run:
   run_id = run.info.run_id
   y_proba = pipeline.predict_proba(X_test)


   # Evaluation metrics
   auc_test = roc_auc_score(y_test, y_proba, multi_class='ovr')
   logger.info(f"AUC Report: {auc_test}")


   # Log parameters and metrics
   mlflow.log_param("model_type", "LogisticRegression Classifier with preprocessing")
   mlflow.log_metric("auc", auc_test)


   # Log the model
   signature = infer_signature(model_input=X_train, model_output=["setosa"])
   dataset = mlflow.data.from_pandas(iris.frame, name="train_set")
   mlflow.log_input(dataset, context="training")


   mlflow.pyfunc.log_model(
       python_model=ModelWrapper(pipeline),
       artifact_path=f"pyfunc-lg-pipeline-model",
       signature=signature,
   )
Downloading the artifacts
This is how the logged model looks like in the Databricks workspace:
To download an artifact from your Databricks workspace to your local machine, you first need to configure your environment for secure access.
Start by setting the MLflow tracking URI to point to your Databricks workspace:
Once authenticated, you can use the MLflow CLI to download artifacts. The following command downloads a specific artifact from a given MLflow run to a designated local directory:
mlflow artifacts download -r <mlflow_run_id> -a <artifact_name> -d <destination>
For example, to download a model artifact named `pyfunc-lg-pipeline-model` from a particular run, you might use:
uv run mlflow artifacts download -r b4bad079af4649dba6fffc51f33b8902 -a pyfunc-lg-pipeline-model -d .
This flow ensures that ML artifacts tracked in Databricks are easily retrievable for local testing, validation, or deployment pipelines, supporting robust ML operations and reliable API contract testing. This generates a local directory with the following structure inside iris-mlflow-serve-testing project:
The `MLmodel` file defines the model’s flavors (e.g., `python_function` or `sklearn`), while `conda.yaml` and `requirements.txt` ensure environment reproducibility.
Local Model Deployment
At this stage, you have already set up a virtual environment as described in the prerequisites step. Make sure that pyenv is installed before you proceed.
Now you can serve the model through MLflow's local inference server on a custom port (5088 in this example):
uv run mlflow models serve -m pyfunc-lg-pipeline-model --port 5088
Now we are ready to test the model locally. The MLflow model server will listen for incoming requests on the specified port (5088). You can send requests to this endpoint to test the model's behavior.
Endpoint testing
At this early stage, testing the Inference API Contract — checking input/output formats, response consistency — helps ensure your model will work smoothly with downstream systems. Doing this early means you catch integration problems before scaling up to full deployment on Databricks, saving time and reducing headaches later.
MLflow Inference Server provides 4 endpoints: ping, health, version and invocations. As Databricks model serving differs from the local deployment, and we can only test to a certain extent, we are only interested in the /invocations endpoint that returns model’s predictions for a given input.
The /invocations endpoint accepts data in the dataframe_split of dataframe_records format (it is also possible to provide Tensor input, but that would require a different model specification, hence is not relevant for our example).
As mentioned in the documentation, it is not advised to use dataframe_records, let’s proceed with testing using dataframe_split instead.
Assume we have the following test_data and we need to convert them to a pandas dataframe so that we can pass the data to the endpoint.
When the correct input (a single observation or a dataframe with multiple observations) is provided, we get status 200
When we provide input with too few fields, we get status 400
Here is an example of one such test:
def test_inference_server_invocations() -> None:
   """Test model invocations using split dataframe format.
   Verifies successful response and valid prediction format."""

   response = requests.post(
       f"{BASE_URL}/invocations",
       data=payload_dataframe_split,
       headers={"Content-Type": "application/json"},
       timeout=2,
   )
   assert response.status_code == 200
   logger.info(f"Received {response.json()}")
   value = response.json()["predictions"]
   assert isinstance(value, list)
We can simply run `uv run pytest` and make sure all tests pass.
Conclusions
Deploying machine learning models can be tricky, especially when different teams handle model creation and deployment. It's easy to run into issues that take time to fix once the model is live.
Testing your models locally before deploying them to Databricks can save you time and headaches. By downloading your model, running it on your computer, and testing its inputs and outputs, you can catch problems early. This way, you can be more confident that your model will work correctly when deployed, leading to a smoother process overall. Tools like MLflow make this local testing easier. This approach means fewer surprises and a more reliable deployment.
It covers everything you need for an actual production-grade AI application, from developing on Databricks, experiment tracking with MLflow, registering models in Unity Catalog, deploying real-time endpoints, workflow orchestration, and CI/CD pipelines.


Thank you for contributing to Decoding ML with this fantastic article! I hope people will release the pure value from your course.