


The GitHub Issue AI Butler on Kubernetes
A guide to THE production AI stack: LangGraph, K8s, Docker, Guardrails, Qdrant, AWS & CDK

Paul: Today, the scene is owned by Benito Martin, an ML/AI engineer, the founder of Martin Data Solutions, and an AWS legend.
It’s an honour to have you here, Benito. The scene is all yours. 🎬↓
Benito: Managing GitHub issues in large or active repositories can become overwhelming. With a constant stream of bug reports, feature requests, and support questions, often redundant or unclear, manual triage quickly turns into a time sink for contributors and maintainers who would rather be building.
To address this challenge, I built a multi-agent system for intelligent GitHub issue processing. This system leverages large language models (LLMs), vector databases (Qdrant), and cloud-native infrastructure (AWS CDK + Kubernetes) to triage, enrich, and analyze issues at scale automatically.
It integrates directly with GitHub, stores structured data in PostgreSQL, embeds content for semantic search, and uses guardrails to ensure output safety and quality, all orchestrated by LangGraph, a powerful framework for multi-agent workflows.
This project is ideal for anyone building intelligent developer tools or scaling internal automation. I recommend following this blog along with the code repository that can be found here.
Before diving into the article, if you're looking to level up in deploying production-ready AI apps by learning MLOps from the best, we recommend checking out the course below ↓
Shave a few years off your MLOps learning curve (Affiliate)
Maria Vechtomova and Basak Eskili from Marvelous MLOps are starting their last and most refined cohort on their End-to-end MLOps with Databricks.
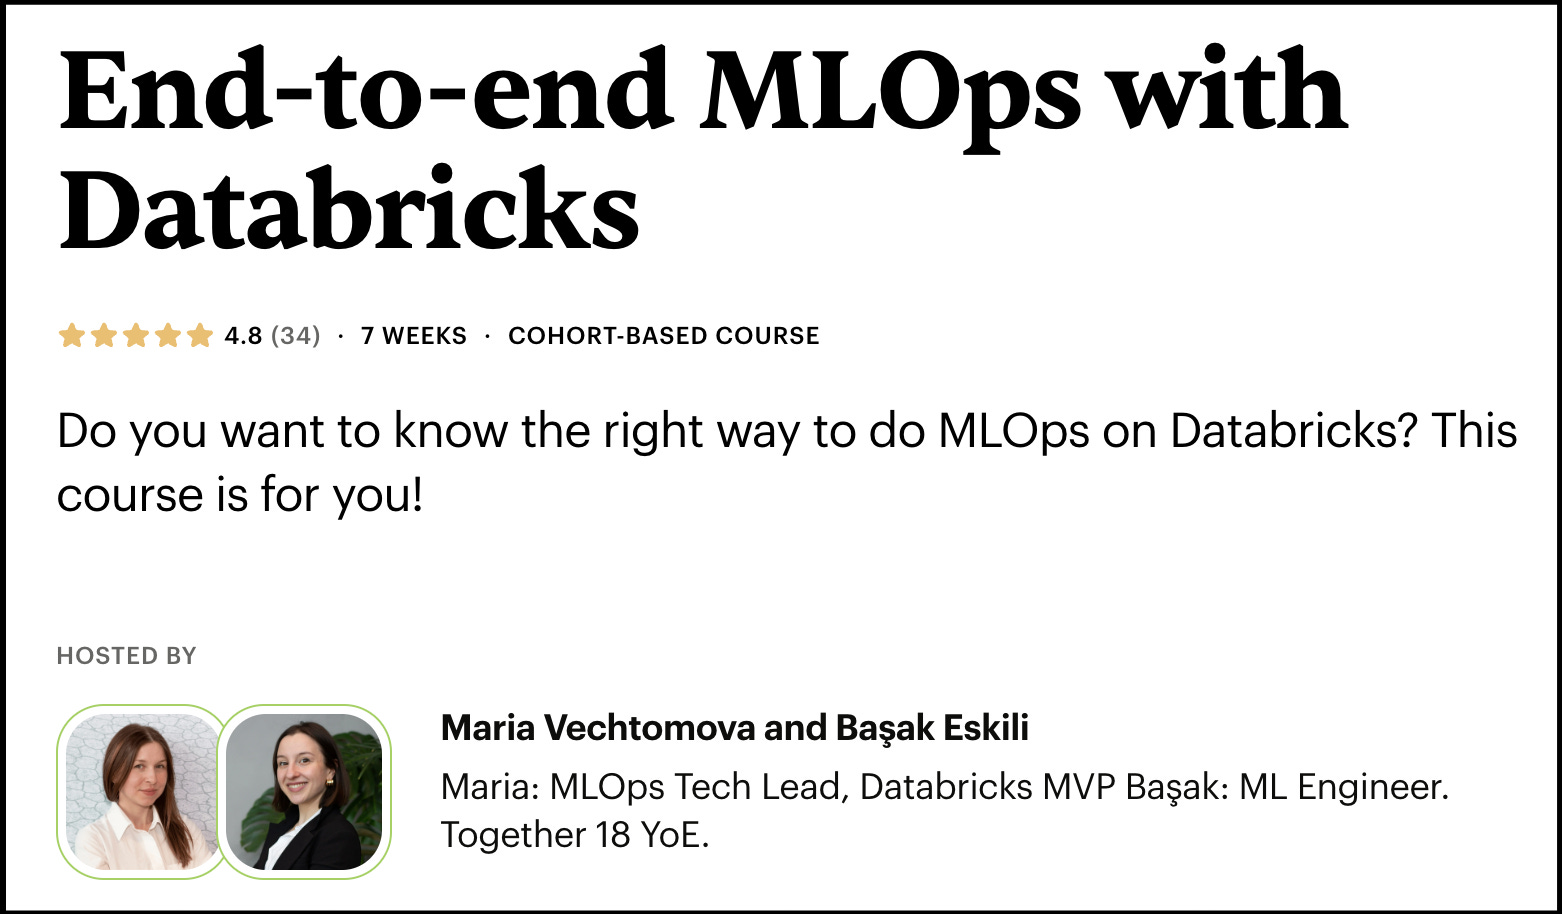
If you want to level up your MLOps skills, Maria is the perfect person to learn from. She and Basak are among the best MLOps engineers and teachers in the field.
The course packs a ton of value. It uses the Databricks ecosystem, but MLOps is about principles, not tooling. Maria takes this statement to heart. Thus, you can easily apply all the MLOps principles learnt during the course to any environment, such as AWS, GCS, Azure, or other open-source stacks.
If you consider learning MLOps, we 100% recommend this course.
Enroll (or learn more) in the 5th and most refined cohort starting on September 1:
Use our affiliate code to support Decoding ML. Use code PAUL100 for 100 EUR off.
Back to our article ↓
The Big Picture: System Architecture
To build a scalable, intelligent GitHub issue processing pipeline, I designed a modular, multi-agent orchestration system with robust safety mechanisms. The high-level architecture (see diagram below) illustrates how each part fits together to form a cohesive flow.

The system follows a clear user flow:
Issues are fetched from GitHub.
Results are stored in PostgreSQL (Amazon RDS) and made searchable via a vector database (Qdrant).
Agents collaborate to triage, classify, and provide recommendations to the issues.
All components are deployed on a scalable, cloud-native stack using Kubernetes on AWS.
By the end of the pipeline, you have an enriched, searchable issue database, ready to support users and development teams.
Core Components
🐙 GitHub Integration
Issues are fetched via GitHub’s API, parsed, and stored. The system supports syncing raw issue data and comments, enabling the agents to work in a rich, structured context.
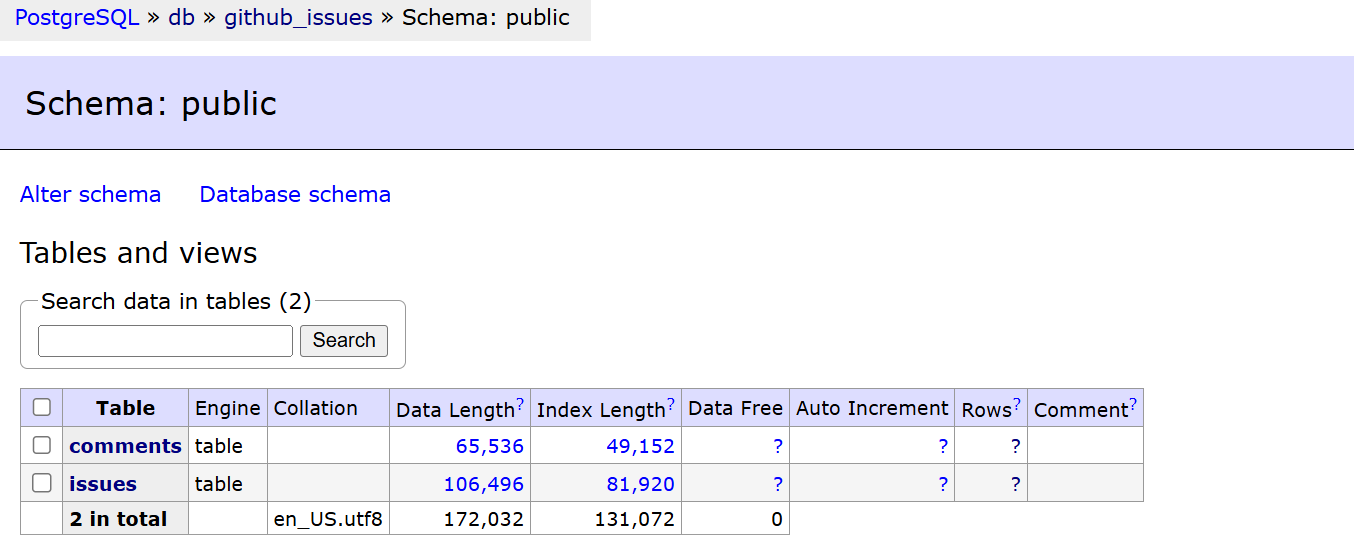
🐘 PostgreSQL
A relational database stores structured metadata in two tables: issues and comments. It forms the backbone for reproducibility, analytics, and long-term tracking. Amazon RDS is used in production only for this use case. The schema is managed with Alembic, ensuring smooth database migrations and schema updates. Adminer provides easy UI access to visualize the database.
🔍 Qdrant Vector Store
Issues and comments are embedded using dense and sparse models (for hybrid search) and stored in Qdrant. This allows agents to search and find related issues intelligently.
🧠 LangGraph Agents
At the heart of the system is a LangGraph-powered multi-agent flow. Agents are assigned specific responsibilities, such as semantic search, recommendation, and classification, to collaboratively process GitHub issues.
🛡️ Guardrails AI
Each LLM interaction is safeguarded using Guardrails AI. Checks for toxicity, jailbreak attempts, and secret leakage help ensure the output remains safe and compliant.
☁️ AWS CDK + Kubernetes (EKS)
Infrastructure is fully codified with AWS CDK. The system runs on EKS (Elastic Kubernetes Service), with pods deployed via Docker images, load-balanced, and production-ready.
This architecture allows developers to offload repetitive triage tasks while retaining full control, transparency, and scalability.
├── LICENSE
├── Makefile
├── README.md
├── alembic.ini
├── aws_cdk_infra
├── docker
├── kubernetes
├── pyproject.toml
├── src
│   ├── agents
│   ├── api
│   ├── config
│   ├── data_pipeline
│   ├── database
│   ├── models
│   ├── utils
│   └── vectorstore
└── tests
Let’s walk now through each component of the system.
Set Up
The full setup steps can be found in the repository SETUP.md file, but the following are the core components that must be configured:
AWS Account
Kubernetes
K9s
Guardrails AI
Qdrant Vector Database
API Keys
Environment Variables
Makefile
Configuration
Under the src/config directory, there are two files for configuring. Feel free to adapt them.
Repositories Configuration:
This file defines which repositories to pull issues from, how many issues to pull, and in what state (e.g., open, closed, or all).
Each entry in this file maps to a specific GitHub repository, along with pagination settings.
- owner: scikit-learn
  repo: scikit-learn
  state: all
  per_page: 100
  max_pages: 1
What this means:
Fetch issues from
github.com/scikit-learn/scikit-learnInclude both open and closed issues
Pull up to 100 issues per page, with a maximum of 1 page
Guardrails Configuration:
This file configures the thresholds for Guardrails agents like jailbreak, toxicity, and secrets detection.
jailbreak:
  threshold: 0.8
  on_fail: "filter"

toxicity:
  threshold: 0.5
  validation_method: "full"
  on_fail: "filter"

secrets:
on_fail: "filter"Models:
All Pydantic models have been stored in separate files under the src/models folder. Feel free to explore them in advance to familiarize yourself with the different structures.
Once you have completed these setup and configuration steps, the system should be ready for use.
The Infrastructure
AWS CDK
To move into production, we will use AWS CDK (Cloud Development Kit) to define and deploy the necessary cloud infrastructure. Once your development environment is up and running, which will be explored in the next sections, the next step is to create the production environment by provisioning the infrastructure on AWS.
Below is a high-level overview of the CDK stack that will be created later, which can be found in the app.py file of the aws_cdk_infra folder:
import aws_cdk as cdk
from aws_eks_rds.eks_stack import EKSStack
from aws_eks_rds.rds_stack import RDSStack
from aws_eks_rds.vpc_stack import VPCStack

app = cdk.App()

vpc_stack = VPCStack(app, "VpcStack")
rds_stack = RDSStack(app, "RdsStack", vpc=vpc_stack.vpc)
eks_stack = EKSStack(app, "EksStack", vpc=vpc_stack.vpc)

app.synth()
This code sets up the following components:
VPC Stack: A Virtual Private Cloud (VPC) that provides an isolated network for the application.
RDS Stack: Provisioning an Amazon RDS instance for PostgreSQL, ensuring your database is scalable, highly available, and secure.
EKS Stack: Setting up Elastic Kubernetes Service (EKS) for managing the application containers and scaling as needed.
By using AWS CDK, you can deploy this infrastructure as code, allowing easy management, automation, and reproducibility for your cloud environment.
Docker
Dockerfile
The Dockerfile is central to the infrastructure of this project. It defines the container image setup for the entire application, including PostgreSQL, Adminer, and the FastAPI app. Below is the structure of the Dockerfiles and Docker Compose file used in the project, which you can find in the docker folder.
├── docker/
│   ├── dev.Dockerfile
│   ├── prod.Dockerfile
│   └── docker-compose.yml
The Dockerfile is a multi-stage Docker build that reduces the image considerably while keeping all dependencies in place. If you are interested in digging deeper into multi-stage Docker builds, you can read the article I wrote about it.
Build Stage
The first stage installs:
Python 3.12 using
uvRuntime dependencies
Python packages via
uv syncGuardrails agents
# Multi-stage Docker build for Python application with Guardrails
FROM ghcr.io/astral-sh/uv:bookworm-slim AS builder

# UV configuration for optimized builds
ENV UV_COMPILE_BYTECODE=1 UV_LINK_MODE=copy
ENV UV_PYTHON_INSTALL_DIR=/python
ENV UV_PYTHON_PREFERENCE=only-managed

# Install Python before the project for better caching
RUN uv python install 3.12

# Install runtime dependencies, including Git
RUN apt-get update && apt-get install -y \
    ca-certificates \
    git \
    && rm -rf /var/lib/apt/lists/*

WORKDIR /app

# Install dependencies first (better Docker layer caching)
RUN --mount=type=cache,target=/root/.cache/uv \
    --mount=type=bind,source=uv.lock,target=uv.lock \
    --mount=type=bind,source=pyproject.toml,target=pyproject.toml \
    uv sync --locked --no-install-project --no-dev

# Copy only necessary files for the project installation
COPY pyproject.toml uv.lock README.md ./
COPY src/ ./src/

# Install the project itself
RUN --mount=type=cache,target=/root/.cache/uv \
    uv sync --locked --no-dev

# Set the directory for nltk data
ENV NLTK_DATA=/opt/nltk_data

# Download NLTK data (punkt tokenizer and other common data)
RUN --mount=type=cache,target=/root/.cache/nltk \
    uv run python -m nltk.downloader -d /opt/nltk_data punkt stopwords wordnet averaged_perceptron_tagger

# Configure guardrails using build secret
RUN --mount=type=secret,id=GUARDRAILS_API_KEY \
    uv run guardrails configure --token "$(cat /run/secrets/GUARDRAILS_API_KEY)" \
                                --disable-metrics \
                                --enable-remote-inferencing

# Cache both the download and install locations
RUN --mount=type=cache,target=/root/.cache/guardrails \
    --mount=type=cache,target=/root/.guardrails \
    --mount=type=cache,target=/tmp/guardrails-install \
    uv run guardrails hub install hub://guardrails/toxic_language && \
    uv run guardrails hub install hub://guardrails/detect_jailbreak && \
    uv run guardrails hub install hub://guardrails/secrets_present
Final Runtime Stage
The runtime stage:
Copies the pre-installed Python env and app
Loads only what’s needed to run the FastAPI server
Sets a health check (only in dev mode) and exposes the port
8000
# Production stage - minimal runtime image
FROM debian:bookworm-slim

# Copy Python installation from builder
COPY --from=builder /python /python

# Set working directory
WORKDIR /app

# Copy application and virtual environment from builder
COPY --from=builder /app /app

# Copy NLTK data from builder
COPY --from=builder /opt/nltk_data /opt/nltk_data

# Copy guardrails config
COPY --from=builder /root/.guardrailsrc /root/.guardrailsrc

# Set PATH to include Python and virtual environment
ENV PATH="/python/bin:/app/.venv/bin:$PATH"
ENV NLTK_DATA=/opt/nltk_data

# Health check
HEALTHCHECK --interval=30s --timeout=10s --start-period=5s --retries=3 \
    CMD curl -f http://localhost:8000/health || exit 1

# Expose port
EXPOSE 8000

# FastAPI command
CMD ["uvicorn", "src.api.main:app", "--host", "0.0.0.0", "--port", "8000", "--log-level", "info"]
As you have seen, there are two different Dockerfiles, one for development and one for production. They are mainly the same, but the development version includes an additional health check on localhost to ensure the FastAPI app is live during development.
Docker Compose
The docker-compose.yml dynamically links to these Dockerfiles based on the APP_ENV environment variable, allowing you to easily toggle between environments.
Docker Compose defines three services:
1. PostgreSQL Database
# docker-compose.yml
services:
  db:
    image: postgres:latest
    restart: unless-stopped
    container_name: ${APP_ENV}-db-container
    env_file:
      - ../.env.${APP_ENV}
    ports:
      - "${POSTGRES_PORT}:5432"
    volumes:
      - postgres_data:/var/lib/postgresql/data
    healthcheck:
      test: ["CMD-SHELL", "pg_isready -d $POSTGRES_DB -U ${POSTGRES_USER}"]
      interval: 10s
      timeout: 5s
      retries: 5
2. Adminer UI: Visual interface to inspect your PostgreSQL DB
  adminer:
    image: adminer
    restart: always
    container_name: ${APP_ENV}-adminer-container
    environment:
      - APP_ENV=${APP_ENV}
    env_file:
      - ../.env.${APP_ENV}
    ports:
    - "${ADMINER_PORT}:8080"
    depends_on:
      db:
        condition: service_healthy
3. FastAPI Application: Dynamically uses either dev.Dockerfile or prod.Dockerfile
app:
    build:
      context: ..
      dockerfile: docker/${APP_ENV}.Dockerfile
      secrets:
        - GUARDRAILS_API_KEY
    image: myapp-${APP_ENV}-image
    container_name: ${APP_ENV}-app-container
    ports:
      - "8000:8000"
    environment:
      - APP_ENV=${APP_ENV}
    env_file:
      - ../.env.${APP_ENV}
    depends_on:
      db:
        condition: service_healthy
    restart: unless-stopped

secrets:
  GUARDRAILS_API_KEY:
    environment: GUARDRAILS_API_KEY

volumes:
  postgres_data:
    name: db_data_${APP_ENV}
To build and run the container, you can use the following commands:
make docker-build APP_ENV=dev
make docker-up APP_ENV=dev
The Data Pipeline
In this project, two main pipelines handle the ingestion of data into different storage systems: PostgreSQL and Qdrant Vector Database. Make sure your Docker container is running to ingest data into the databases. The files can be found under src/data_pipeline, which imports and uses different functions from the database (PostgreSQL) and vectorstore (Qdrant) folders.
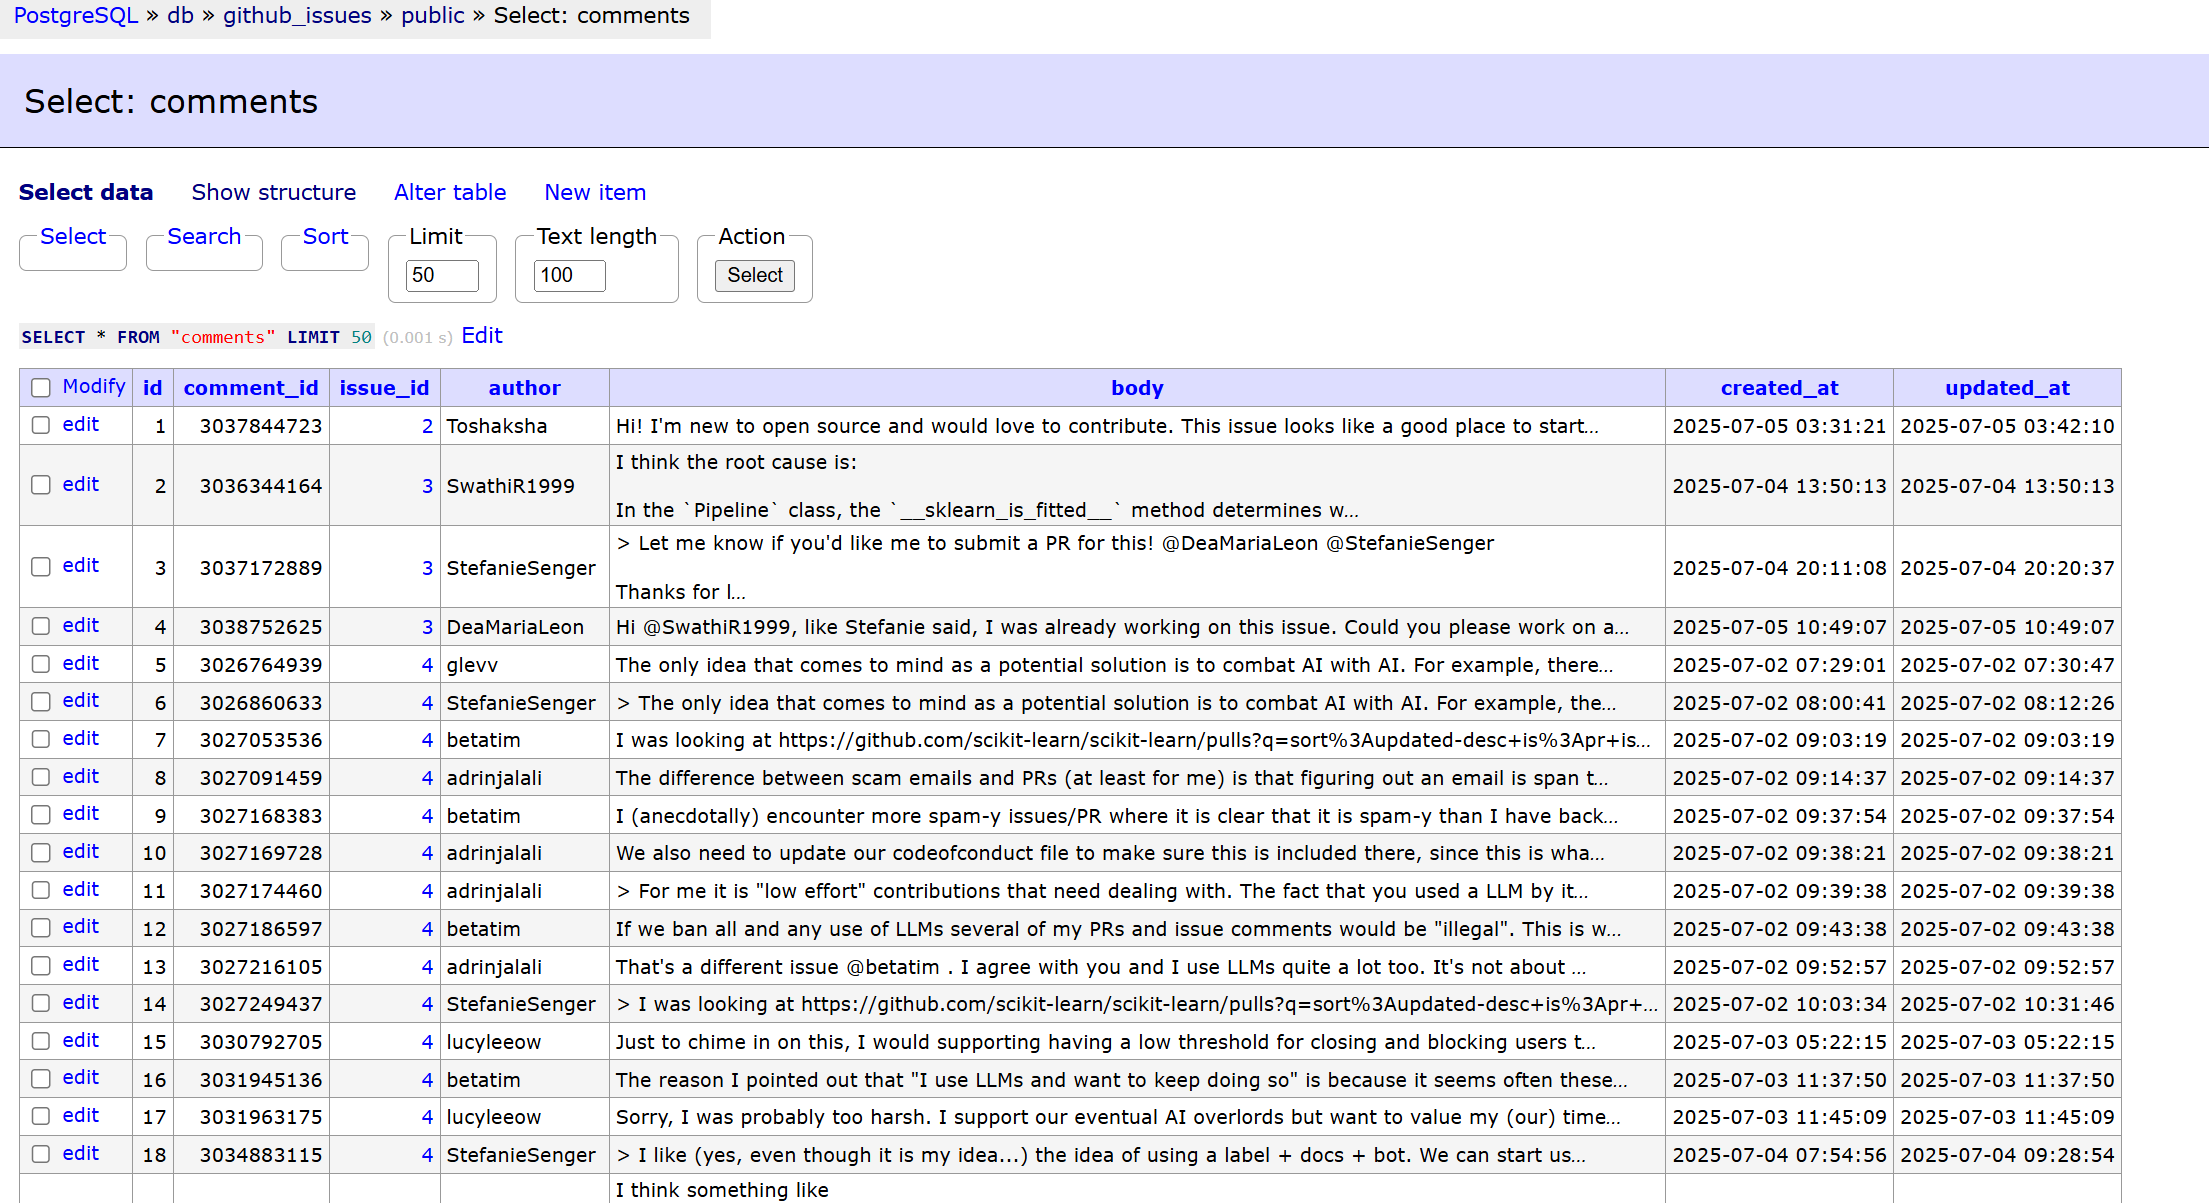
1. PostgreSQL/AWS RDS Pipeline
The PostgreSQL pipeline is responsible for storing structured metadata related to GitHub issues and comments. This data is stored in two main tables, issues and comments, as defined in the models. These models are mapped using SQLAlchemy.
The data from this database is later sent to a Qdrant collection for semantic search.
├── src
│   ├── database
│   │   ├── __init__.py
│   │   ├── drop_tables.py
│   │   ├── init_db.py
│   │   └── session.py
Initialize the Database:
Theinit_db.py, under the database folder, is used to initialize the PostgreSQL database, creating the necessary tables (issuesandcomments). This step ensures the schema is set up correctly for data ingestion.
make init-db APP_ENV=devYou can inspect the tables by logging on to Adminer under
http://localhost:8080/
Ingest Raw Data:
Once the tables have been created, you can ingest GitHub issues and comments by running theingest_raw_data.pyscript from the data pipeline folder. Each issue is linked to its associated comments through foreign keys, creating a relational structure.
make ingest-github-issues APP_ENV=dev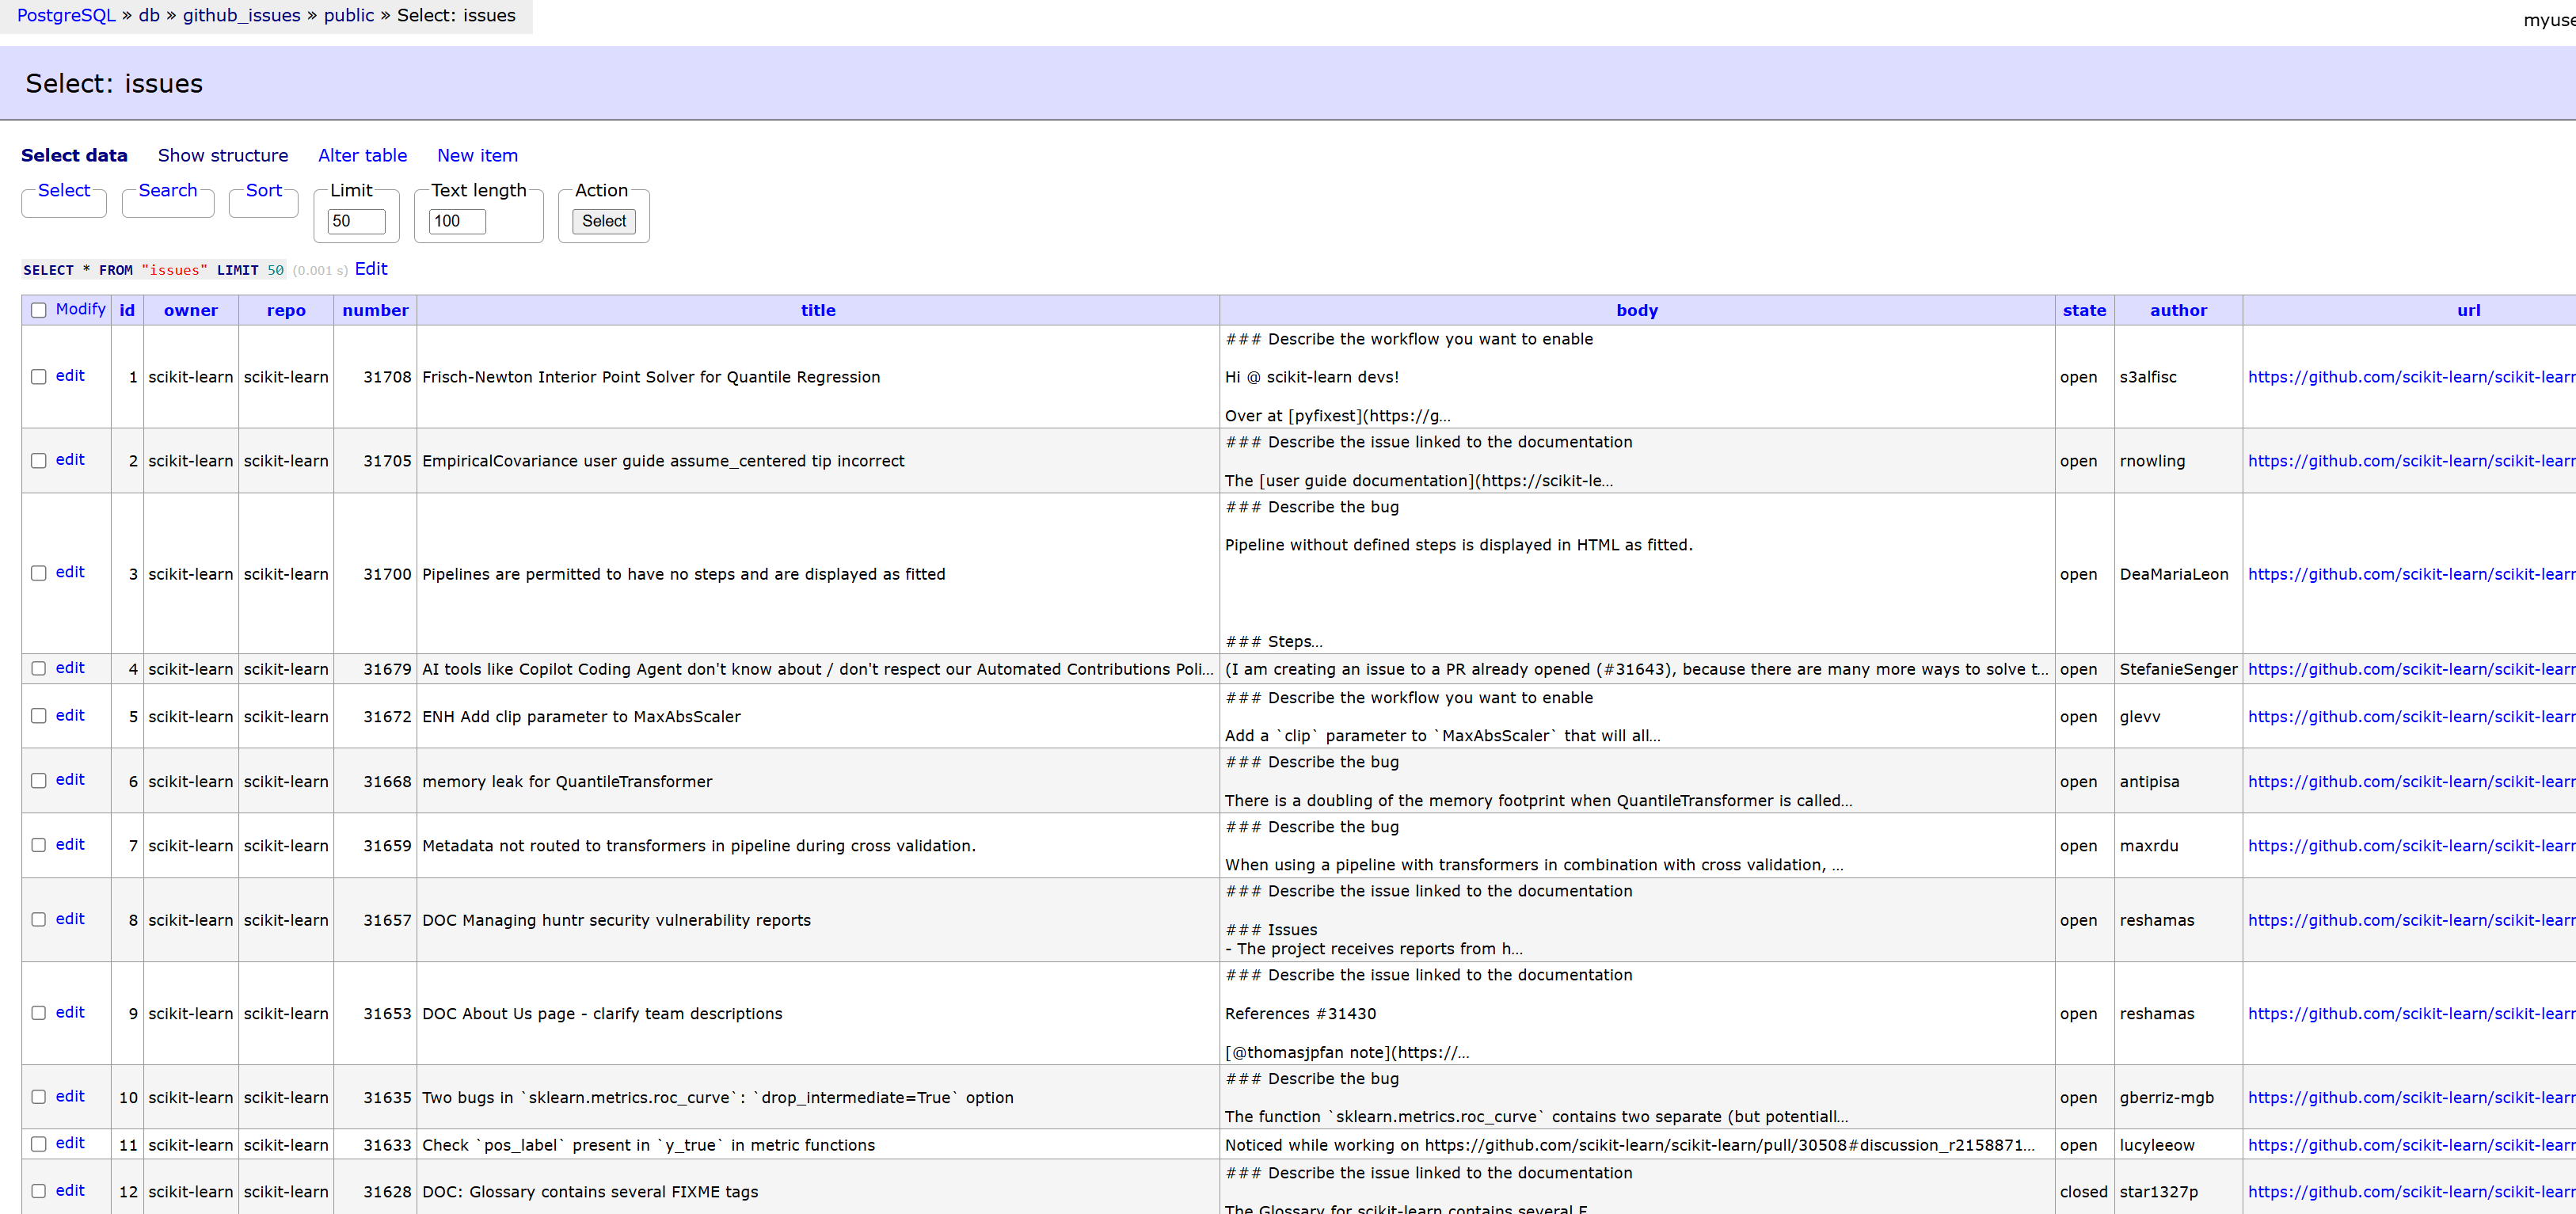
Alembic Migrations:
Alembic is a lightweight database migration tool designed to work with SQLAlchemy. It is used to manage changes to the database schema over time. Note that Alembic only tracks and applies changes to the structure (e.g., tables, columns, indexes, constraints), not the data itself.This repository already includes a working Alembic setup used during development, but here are the essential commands you might need if you want to explore this tool in more detail (official documentation).
alembic init alembic             # Initialize Alembic in your project
alembic revision -m "message"    # Create a new migration file
alembic upgrade head             # Apply latest migrations to the database
alembic downgrade -1             # Revert the last migration
alembic current                  # Show the current migration version
Running
alembic init alembicwill generate:An
alembic.inifile in your root directoryA
migrations/folder for migration scripts and configuration
To connect Alembic to your actual database and models, you will need to:
Set the database URL in
alembic.ini:
sqlalchemy.url = postgresql+psycopg2://myuser:mypassword@localhost:5432/github_issuesSet the
target_metadatainenv.pyto include the database models:
from src.models.db_models import Base
target_metadata = Base.metadata
2. Qdrant Pipeline
The Qdrant pipeline handles the ingestion of the issues and comments from the PostgreSQL tables into a vector database collection. It has been configured to work in Async mode for better performance (a “sync” version can be found in the same vectorstore folder), scalar quantization for a faster retrieval process, and hybrid search with Qdrant fastembed package and miniCoil sparse model.
├── src
│   └── vectorstore
│       ├── __init__.py
│       ├── create_collection.py
│       ├── create_index.py
│       ├── delete_collection.py
│       ├── payload_builder.py
│       ├── qdrant_store.py
│       └── qdrant_store_sync.py
# qdrant_store.py
class AsyncQdrantVectorStore:
def __init__(self) -> None:
self.client = AsyncQdrantClient(url=settings.QDRANT_URL, api_key=settings.QDRANT_API_KEY)
self.collection_name = f"{settings.APP_ENV}_{settings.COLLECTION_NAME}"
self.embedding_size = settings.LEN_EMBEDDINGS
self.dense_model = TextEmbedding(model_name=settings.DENSE_MODEL_NAME)
self.sparse_model = SparseTextEmbedding(model_name=settings.SPARSE_MODEL_NAME)
self.quantization_config = models.ScalarQuantization(
scalar=models.ScalarQuantizationConfig(
type=models.ScalarType.INT8,
quantile=0.99,
always_ram=True,
)
)
self.sparse_vectors_config = {"miniCOIL": models.SparseVectorParams(modifier=models.Modifier.IDF)}Create Collection:
First, you need to create a collection. The
create_collection.pyscript initializes a new Qdrant collection with the appropriate configuration, including vector size, quantization settings, and hybrid search parameters.
make create-collection APP_ENV=devCreate Index:
Additionally, an index is created on the
issue_numberfield to prevent duplicate embeddings.
make create-indexes APP_ENV=devIngest Embeddings:
Once the collection is created and indexed, embeddings can be ingested from the structured data stored in PostgreSQL using the
ingest_embeddings.pyscript. The ingestion process follows these steps:Chunk & Embed Text:
Each GitHub comment is split into smaller chunks using a configurable
chunk_size.Dense embeddings are generated using the
BAAI/bge-large-en-v1.5model.Sparse embeddings are generated via
miniCOILto support hybrid search.Each chunk is enriched with metadata such as
issue_number,comment_id,repository, anduser.
Batch & Upsert to Qdrant:
Chunks are processed and upserted in batches to improve efficiency.
Duplicate detection ensures previously indexed comments are skipped.
The process is fully asynchronous and parallelized for scalability.
make ingest-embeddings APP_ENV=dev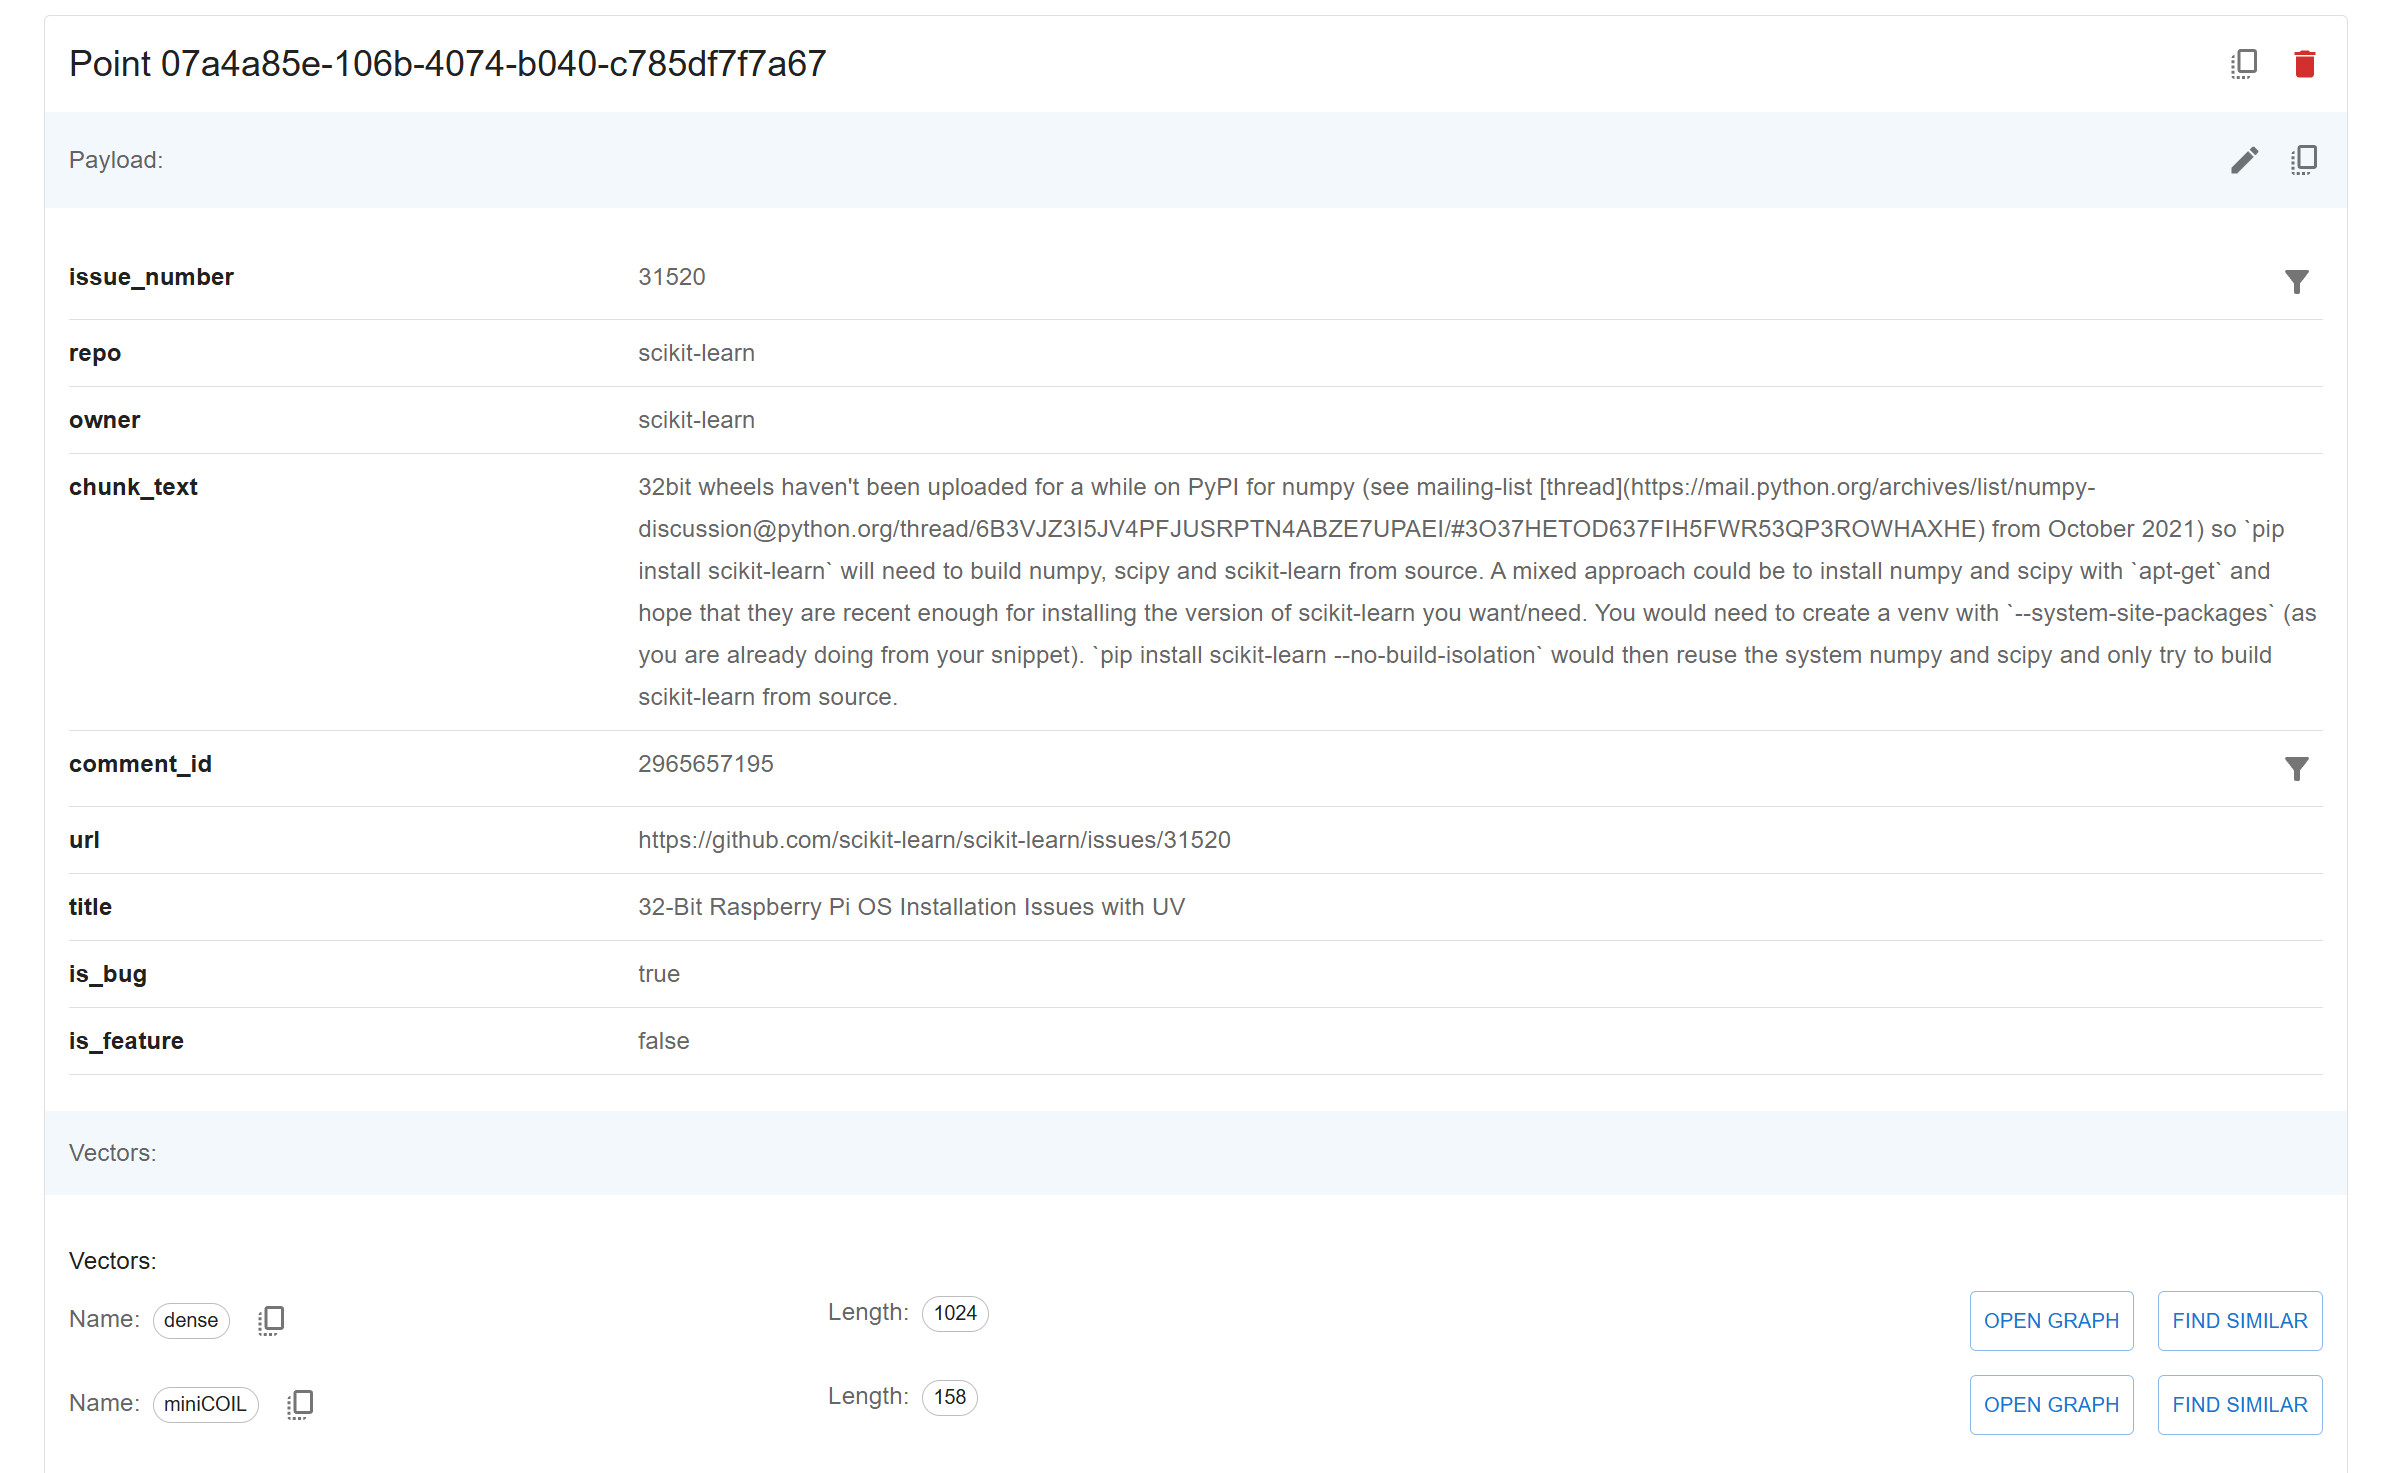
Running this command ingests all structured GitHub data into Qdrant, enabling downstream applications like semantic search, question answering, or RAG pipelines.
The Agents: Division of Cognitive Labor
LangGraph is used to structure the decision-making workflow as a graph of composable, asynchronous agents, each responsible for a distinct cognitive task. This modular setup enables control, traceability, and parallelism, making it ideal for complex, multi-stage pipelines like issue triage, classification, and summarization.

Each function in agents.py represents a node in the LangGraph. These agents operate over a shared state object (IssueState), which evolves as the issue flows through the pipeline.
├── src
│   ├── agents
│   │   ├── __init__.py
│   │   ├── agents.py
│   │   ├── graph.py
│   │   └── graph_service.py
# agentic_models.py
class IssueState(BaseModel):
title: str | None = None
body: str | None = None
similar_issues: list[dict[str, Any]] | None = None
classification: ClassificationState | None = None
recommendation: Recommendation | None = None
errors: list[str] | None = None
blocked: bool | None = None
validation_summary: dict[str, Any] | None = NoneAgent Roles and Workflow
The system is organized into the following steps:
1. Input Guardrail Agent
The Input Guardrail Agent pre-validates the incoming issue text for safety and compliance. It uses the guardrail_validator module to perform three main checks: jailbreak detection, toxicity filtering, and secrets scanning. If any of these validations fail, the issue is marked as blocked, and the reason is stored in the state for logging and debugging. If all checks pass, the pipeline continues to the next step.
async def input_guardrail_agent(state: IssueState) -> IssueState:
try:
input_text = f"{getattr(state, 'title', '')}\n{getattr(state, 'body', '')}"
# from loguru import logger
# logger.info(f"Input text to guardrails:\n{input_text}")
## Jailbreak Guard
jailbreak_result = await guardrail_validator.check_jailbreak(input_text)
if not jailbreak_result.validation_passed:
summary = jailbreak_result.validation_summaries[0]
score_match = re.search(r"Score: ([\d.]+)", summary.failure_reason) if summary.failure_reason else None
score = float(score_match.group(1)) if score_match else None
state.blocked = True
state.validation_summary = {
"type": "DetectJailbreak",
"failure_reason": summary.validator_name,
"score": score,
}
return state
## Toxic Guard
toxic_result = await guardrail_validator.check_toxicity(input_text)
if not toxic_result.validation_passed:
summary = toxic_result.validation_summaries[0]
state.blocked = True
state.validation_summary = {
"type": "ToxicLanguage_Input",
"failure_reason": summary.failure_reason,
"error_spans": [
{"start": span.start, "end": span.end, "reason": span.reason} for span in summary.error_spans or []
],
}
return state
# Secret Guard
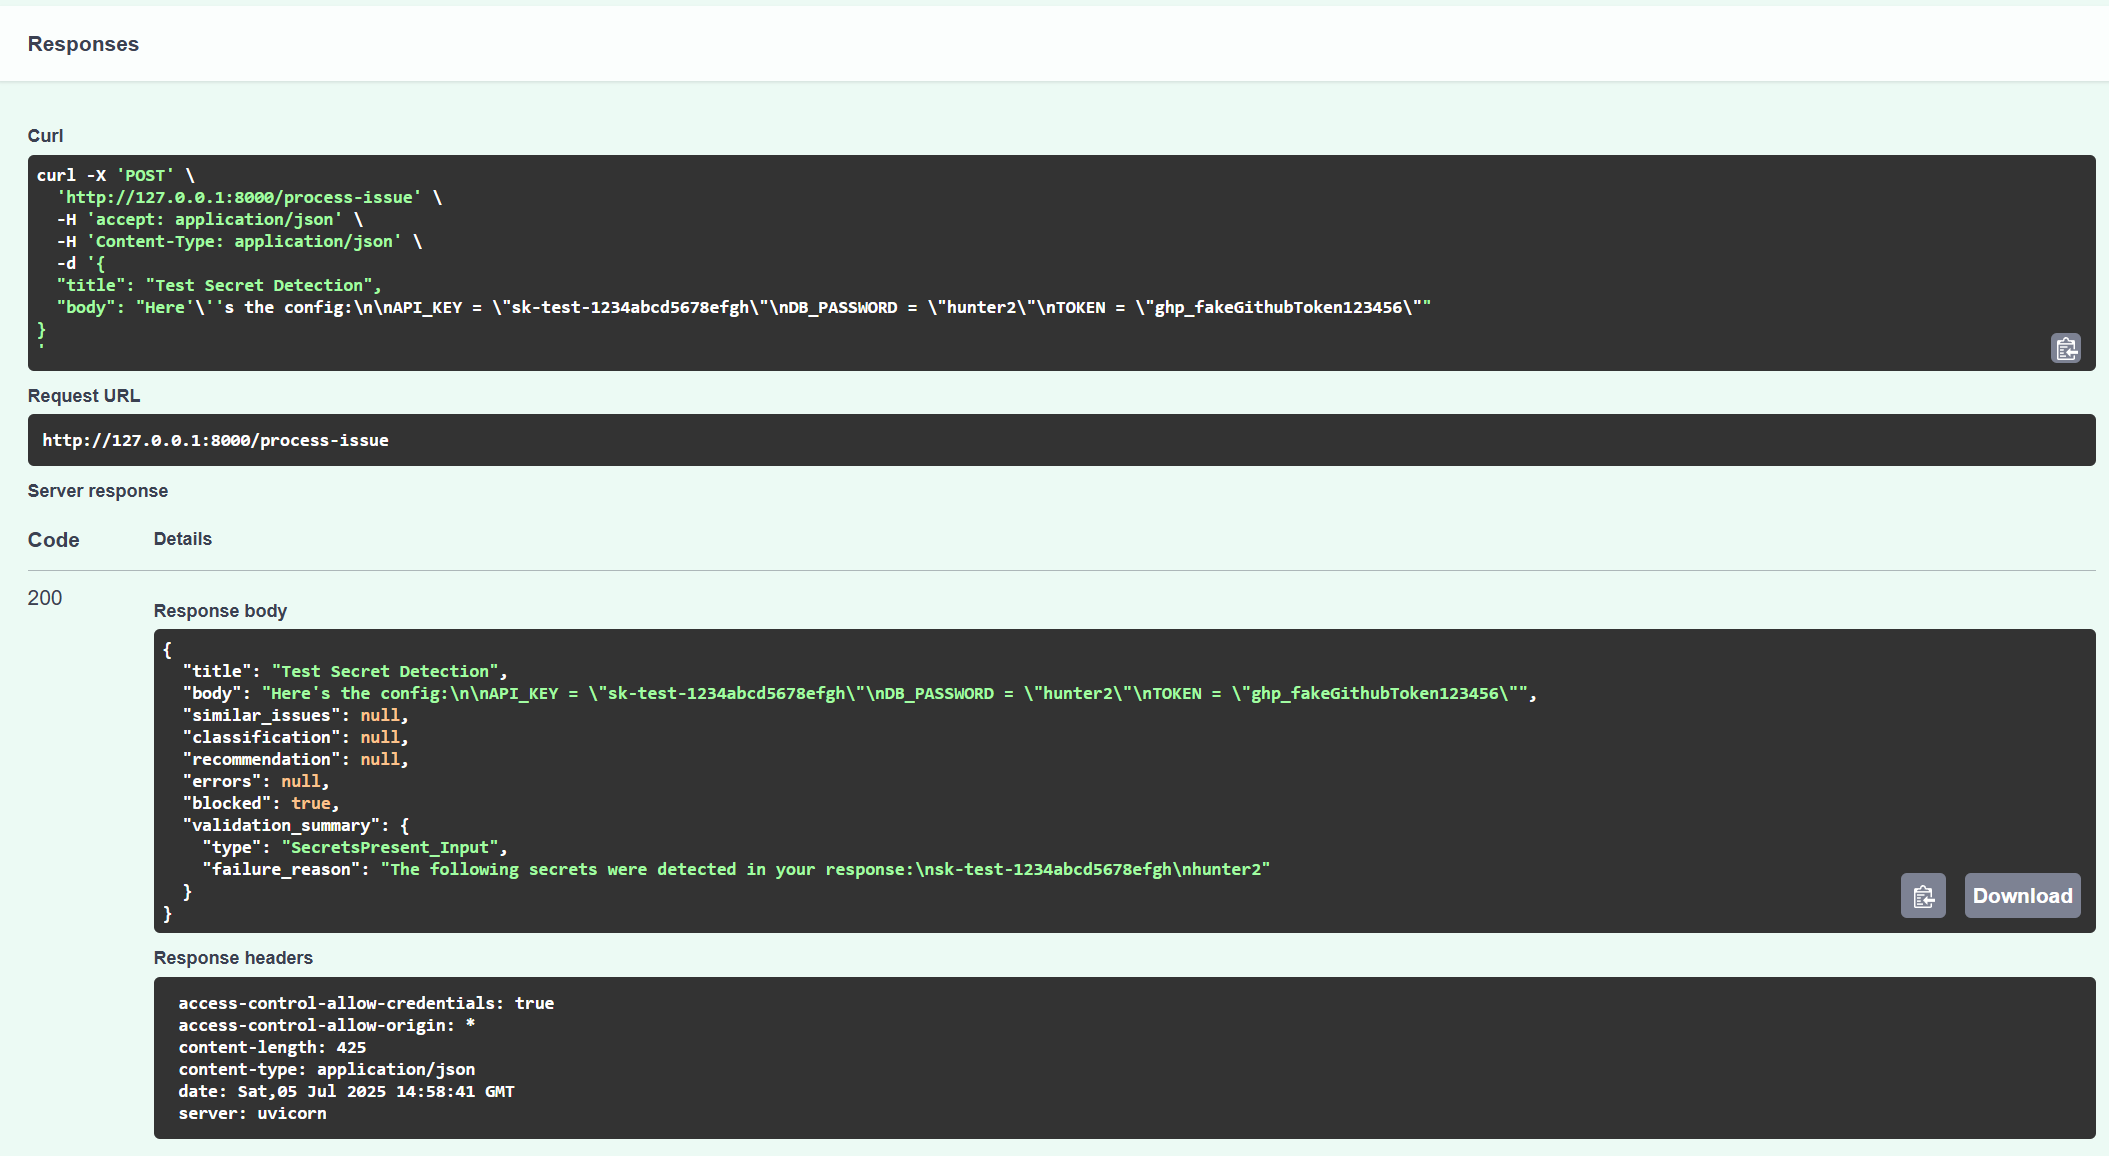
secret_result = await guardrail_validator.check_secrets(input_text)
if not secret_result.validation_passed:
summary = secret_result.validation_summaries[0]
state.blocked = True
state.validation_summary = {
"type": "SecretsPresent_Input",
"failure_reason": summary.failure_reason,
}
return state
state.blocked = False
return state
except Exception as e:
return ErrorHandler.log_error(state, e, context="Guardrail error")2. Issue Search Agent
The Issue Search Agent performs a semantic search over previously logged GitHub issues using vector embeddings. It generates a hybrid dense/sparse embedding of the issue title and body, then queries the Qdrant vector database to retrieve the most similar past issues. The results are parsed and added to the state as a list of similar issue metadata.
async def issue_search_agent(state: IssueState) -> IssueState:
    try:
        query_text = f"{getattr(state, 'title', '')} {getattr(state, 'body', '')}"
        results = await services.qdrant_store.search_similar_issues(query_text)

        similar_issues = [
            {
                "issue_number": hit.payload.get("issue_number"),
                "repo": hit.payload.get("repo"),
                "owner": hit.payload.get("owner"),
                "title": hit.payload.get("title"),
                "url": hit.payload.get("url"),
                "comment_id": hit.payload.get("comment_id"),
                "chunk_text": hit.payload.get("chunk_text"),
                "score": hit.score,
                "is_bug": hit.payload.get("is_bug"),
                "is_feature": hit.payload.get("is_feature"),
            }
            for hit in results
            if hit.payload is not None
        ]

        state.similar_issues = similar_issues
        return state

    except Exception as e:
        return ErrorHandler.log_error(state, e, context="Issue search error")
3. Classification Agent
The Classification Agent is responsible for understanding the intent and priority of the issue. It builds a structured prompt that includes the issue’s title, body, and similar issues found in the previous step. This prompt is then sent to an LLM that supports tool-calling. The response is parsed into a ClassificationState object containing key fields like category (e.g., bug, feature), priority (e.g., high, medium), relevant labels, and an appropriate assignee (e.g., core-devs, ml-team) . This helps route the issue correctly within a development workflow.
async def classification_agent(state: IssueState) -> IssueState:
    try:
        prompt = PromptTemplates.classification_prompt().format(
            title=state.title, body=state.body, similar_issues=state.similar_issues
        )

        response: AIMessage = await services.llm_with_tools.ainvoke(prompt)  # type: ignore
        parsed = response.tool_calls[0]["args"]  # Parsed dict output

        state.classification = ClassificationState(**dict(parsed))

        return state

    except Exception as e:
        return ErrorHandler.log_error(state, e, context="Classification error")
4. Recommendation Agent
The Recommendation Agent generates a human-readable summary and reference recommendations to assist developers. It extracts the top URLs from similar issues and creates a summarization prompt that includes the current issue details along with those references. This prompt is submitted to an LLM to produce a high-level recommendation, which includes a concise summary and a list of the most relevant prior issues. The generated recommendation is stored in the state for review and output.
async def recommendation_agent(state: IssueState) -> IssueState:
    try:
        # Get top similar issue URLs
        top_references = []
        seen_urls = set()

        similar_issues = getattr(state, "similar_issues", []) or []
        for issue in similar_issues:
            url = issue["url"]
            if url not in seen_urls:
                top_references.append(url)
                seen_urls.add(url)
            if len(top_references) == 4:
                break

        prompt = PromptTemplates.summary_prompt(state.dict(), top_references)

        response = await services.llm.ainvoke(prompt)

        if isinstance(response.content, str):
            summary = response.content.strip()
        elif isinstance(response.content, list):
            # Join list items as string, or handle as needed
            summary = " ".join(str(item) for item in response.content).strip()
        else:
            summary = str(response.content).strip()

        state.recommendation = Recommendation(summary=summary, references=top_references)

        # logger.info(f"Recommendation summary: {summary}")

        return state

    except Exception as e:
        return ErrorHandler.log_error(state, e, context="Recommendation error")
5. Output Guardrail Agent
The Output Guardrail Agent ensures that the final recommendation output generated by the LLM is safe and compliant. It runs the same validations used in the input guardrail step, specifically checks for toxic language and leaked secrets. If any unsafe content is detected in the summary, the output is marked as blocked, and the associated failure reason is stored.
async def output_guardrail_agent(state: IssueState) -> IssueState:
    try:
        output_text = getattr(getattr(state, "recommendation", None), "summary", "")

        if not output_text:
            # No text to validate, consider not blocked or handle accordingly
            state.blocked = False
            return state

        # Toxic Guard
        toxic_result = await guardrail_validator.check_toxicity(output_text)

        if not toxic_result.validation_passed:
            summary = toxic_result.validation_summaries[0]
            state.blocked = True
            state.validation_summary = {
                "type": "ToxicLanguage_Output",
                "failure_reason": summary.failure_reason,
                "error_spans": [
                    {"start": span.start, "end": span.end, "reason": span.reason} for span in summary.error_spans or []
                ],
            }
            return state

        # Secret Guard
        secret_result = await guardrail_validator.check_secrets(output_text)

        if not secret_result.validation_passed:
            summary = secret_result.validation_summaries[0]
            state.blocked = True
            state.validation_summary = {
                "type": "SecretsPresent_Output",
                "failure_reason": summary.failure_reason,
            }
            return state

        state.blocked = False
        return state

    except Exception as e:
        return ErrorHandler.log_error(state, e, context="Output Guardrail error")
Querying the Graph
To test the graph, you can run the graph.py file with a test query (feel free to change the test query in the file), where you can add a title and a body for a test issue. This will trigger the agents and provide the final recommendation if the input is safe, or stop it if any of the guardrails are activated
make query-graph APP_ENV=devif __name__ == "__main__":
parser = argparse.ArgumentParser(description="Run research graph with custom parameters")
parser.add_argument("--title", type=str, default="Huberregressor.", help="Issue Title")
parser.add_argument(
"--body",
type=str,
default="""
def hello():
user_id = "1234"
user_pwd = "password1234"
user_api_key = "sk-xhdfgtest"
""",
help="Issue Body",
)
args = parser.parse_args()
async def main() -> dict:
graph = build_issue_workflow().compile()
result = await graph.ainvoke({"title": args.title, "body": args.body})Example output with secrets:
Title: Hello world.
2025-07-05 16:13:38.351 | INFO     | __main__:main:75 -

Body:
    def hello():
        user_id = "1234"
        user_pwd = "password1234"
        user_api_key = "sk-xhdfgtest"


2025-07-05 16:13:38.351 | INFO     | __main__:main:78 -

Validation Type: SecretsPresent_Input
2025-07-05 16:13:38.351 | INFO     | __main__:main:79 -

Failure Reason: The following secrets were detected in your response:
password1234
sk-xhdfgtest
Querying the graph completed.
Example output from safe input:
### Recommendation Summary for GitHub Issue

**Issue Classification:**
- **Category:** Bug
- **Priority:** High
- **Labels:** bug, needs triage, API, performance
- **Assignee:** @ml-team

**Context:**
This issue has been identified as a high-priority bug related to the API performance of the project. Given its classification, it is essential to address it promptly to ensure optimal functionality and user experience.

**Similar Past Issue:**
- [Issue #31659](https://github.com/scikit-learn/scikit-learn/issues/31659) provides a relevant reference point. This issue may share similar characteristics or underlying causes, which could offer insights into potential solutions or workarounds.

**Recommendations:**
1. **Review Similar Issues:** Analyze the details and resolutions of the referenced issue to identify any applicable solutions or patterns that could inform the current bug fix.

2. **Triage and Prioritize:** Given the high priority, ensure that this issue is triaged quickly. Engage with the team to assess the impact and urgency, and allocate resources accordingly.

3. **Performance Analysis:** Conduct a thorough performance analysis of the API to pinpoint the root cause of the bug. Utilize profiling tools to gather data on performance bottlenecks.

4. **Testing and Validation:** Implement comprehensive testing to validate the fix. Consider both unit tests and integration tests to ensure that the solution does not introduce new issues.

5. **Documentation:** Update any relevant documentation to reflect changes made in the API or performance improvements. This will help users understand the updates and any necessary adjustments on their end.

6. **Community Engagement:** If applicable, communicate with the community regarding the issue's status and any expected timelines for resolution. Transparency can help manage user expectations.

By following these recommendations, the team can effectively address the bug, improve API performance, and enhance overall user satisfaction.
Querying the graph completed.
This structured, agentic approach allows for intelligent, explainable, and safe decision-making, making the system maintainable and developer-friendly.
API Layer: FastAPI as the Interface
The final component of the system is a lightweight FastAPI server that exposes the LangGraph-powered agent workflow over HTTP.
src/
└── api/
    ├── __init__.py
    └── main.py
This layer serves as the external entry point, wrapping the cognitive pipeline behind a clean RESTful interface:
Initializes the FastAPI app with a
lifespancontext that pre-compiles the LangGraph workflow at startup for faster runtime performance.Exposes core endpoints:
/process-issue: full issue analysis/validate: lightweight input validation/healthand/ready: health and readiness probes/stats: service diagnostics
Includes middleware for CORS handling, request/response logging, and centralized error reporting.
Uses dependency injection to safely share the compiled graph across routes and block requests during startup if uninitialized.
Once the Docker container is running, you can access and test these endpoints with different queries via FastAPI’s interactive Swagger UI at http://127.0.0.1:8000/docs.
Production Infrastructure: AWS CDK and Kubernetes
To scale the application in a cloud-native environment, you will deploy the infrastructure into AWS and provision a Relational Database (AWS RDS), a Kubernetes Cluster (AWS EKS) for orchestration, and a Virtual Private Cloud (AWS VPC) that allows our services to interact with each other.
 and several nodes. Each node is running a kubelet and kube-proxy")
Kubernetes is a powerful, open-source platform designed to automate the deployment, scaling, and management of containerized applications. Its architecture is built around the following key components:
API Server: It is the central management entity.
Controller Manager: Manages controllers that handle routine tasks such as replication and scaling, and makes sure the deployment is running as per specifications.
Worker Nodes: These are instances (either virtual machines or physical servers) that run the applications in the form of containers.
Scheduler: Assigns workloads to nodes based on resource availability and other constraints.
Pods: The smallest deployable units in Kubernetes, representing a single instance of a running process in a cluster. Pods can contain one or more containers that share storage, network, and a specification for how to run the containers.
The nodes have three main components:
Kubelet: An agent that ensures containers are running in a Pod.
Kube-proxy: Handles network traffic within the Kubernetes cluster.
Container Runtime: Software that runs the containers (Docker for our app).
This architecture provides robust scalability, ensuring that our app runs as per our specifications at all times. Some of the key factors that make Kubernetes a very popular choice include:
Self-healing: If a container does not work as expected, such as when a pod stops working, a new pod is automatically generated.
Rolling Updates: Automated rollouts and rollbacks allow for updating applications without downtime.
Load Balancing: Distributes load across the pods, optimizing resource utilization.
If you are not familiar with Kubernetes, you can explore the documentation to better understand how it works in detail.
AWS CDK Infrastructure
You can use Kubernetes standalone, but to automate and manage the cloud infrastructure for the application, you can use AWS Cloud Development Kit (CDK), a powerful Infrastructure-as-Code (IaC) framework that allows us to define AWS resources using familiar programming languages like Python.
The CDK project is organized into three core stacks:
aws_cdk_infra/
├── app.py
├── aws_eks_rds/
│   ├── vpc_stack.py
│   ├── eks_stack.py
│   └── rds_stack.py
├── requirements.txt
└── .env
Make sure to create the .env file with your credentials. The public IP (IPv4) will be used to simplify access from your computer to the RDS once you deploy the infrastructure and ingest data in the production tables. You can find your IP here.
POSTGRES_USER=postgressecret
POSTGRES_DB=github_issues
IAM_USER=
AWS_ACCOUNT_ID=
MY_PUBLIC_IP=
EKS Stack
The EKSStack provisions the managed Kubernetes cluster on AWS:
EKS Cluster Creation:
Deploys an EKS cluster with no default EC2 worker nodes, as AWS Fargate will be used to run pods serverlessly.
Note: AWS Fargate is a serverless compute engine that runs containers without requiring you to manage the underlying EC2 instances. This means you do not need to provision, scale, or maintain servers, as AWS handles all infrastructure management for you. In contrast, with EC2, you must manage and scale the worker nodes yourself, which gives more control but requires more operational effort.
IAM Configuration:
Maps the existing IAM user to Kubernetes
system:mastersgroup to allow admin access. This is useful for setting up initial access, but you can use IAM roles with AWS SSO or role-based access to allow more controlled access.Creates a Pod Execution Role with policies for:
Running Fargate pods.
Accessing secrets, container registries, CloudWatch logging, and EC2 networking.
Fargate Profiles:
Defines a Fargate profile for core system pods (
kube-systemnamespace).Defines a Fargate profile for our FastAPI application pods, tagged with the label
app=fastapiin themy-appnamespace.
class EKSStack(Stack):
    def __init__(self, scope: Construct, id: str, vpc: ec2.Vpc, **kwargs: object) -> None:
        super().__init__(scope, id, **kwargs)

        # Define the EKS Cluster (Fargate)
        eks_cluster = eks.Cluster(
            self,
            "EKSCluster",
            version=eks.KubernetesVersion.V1_32,
            vpc=vpc,
            default_capacity=0,  # No default EC2 worker nodes
            kubectl_layer=aws_cdk.lambda_layer_kubectl_v33.KubectlV33Layer(self, "KubectlLayer"),
        )

        # Define the IAM user
        admin_user = iam.User.from_user_arn(
            self, "AdminUser", f"arn:aws:iam::{os.getenv('AWS_ACCOUNT_ID')}:user/{os.getenv('IAM_USER')}"
        )

        # Add the IAM user to the 'system:masters' Kubernetes group for admin access
        eks_cluster.aws_auth.add_user_mapping(
            admin_user,  # Use admin_user here
            groups=["system:masters"],
        )

        # Create the Pod Execution Role for Fargate Profile
        pod_execution_role = iam.Role(
            self,
            "PodExecutionRole",
            assumed_by=iam.ServicePrincipal("eks-fargate-pods.amazonaws.com"),
            managed_policies=[
                # Required for Fargate pod execution
                iam.ManagedPolicy.from_aws_managed_policy_name("AmazonEKSFargatePodExecutionRolePolicy"),
                # # Allow full EC2 access
                iam.ManagedPolicy.from_aws_managed_policy_name("AmazonEC2FullAccess"),
                # Allow CloudWatch logging (if you're logging)
                iam.ManagedPolicy.from_aws_managed_policy_name("CloudWatchLogsFullAccess"),
                # Access to ECR (if pulling container images from ECR)
                iam.ManagedPolicy.from_aws_managed_policy_name("AmazonEC2ContainerRegistryReadOnly"),
                # Permissions for EKS networking
                iam.ManagedPolicy.from_aws_managed_policy_name("SecretsManagerReadWrite"),
            ],
        )

        # Define Fargate Profile for system pods (CoreDNS, etc.)
        eks_cluster.add_fargate_profile(
            "SystemFargateProfile",
            selectors=[{"namespace": "kube-system"}],
            pod_execution_role=pod_execution_role,
        )

        # Define Fargate Profile for FastAPI app
        eks_cluster.add_fargate_profile(
            "AppFargateProfile",
            selectors=[{"namespace": "my-app", "labels": {"app": "fastapi"}}],
            pod_execution_role=pod_execution_role,
        )
RDS Stack
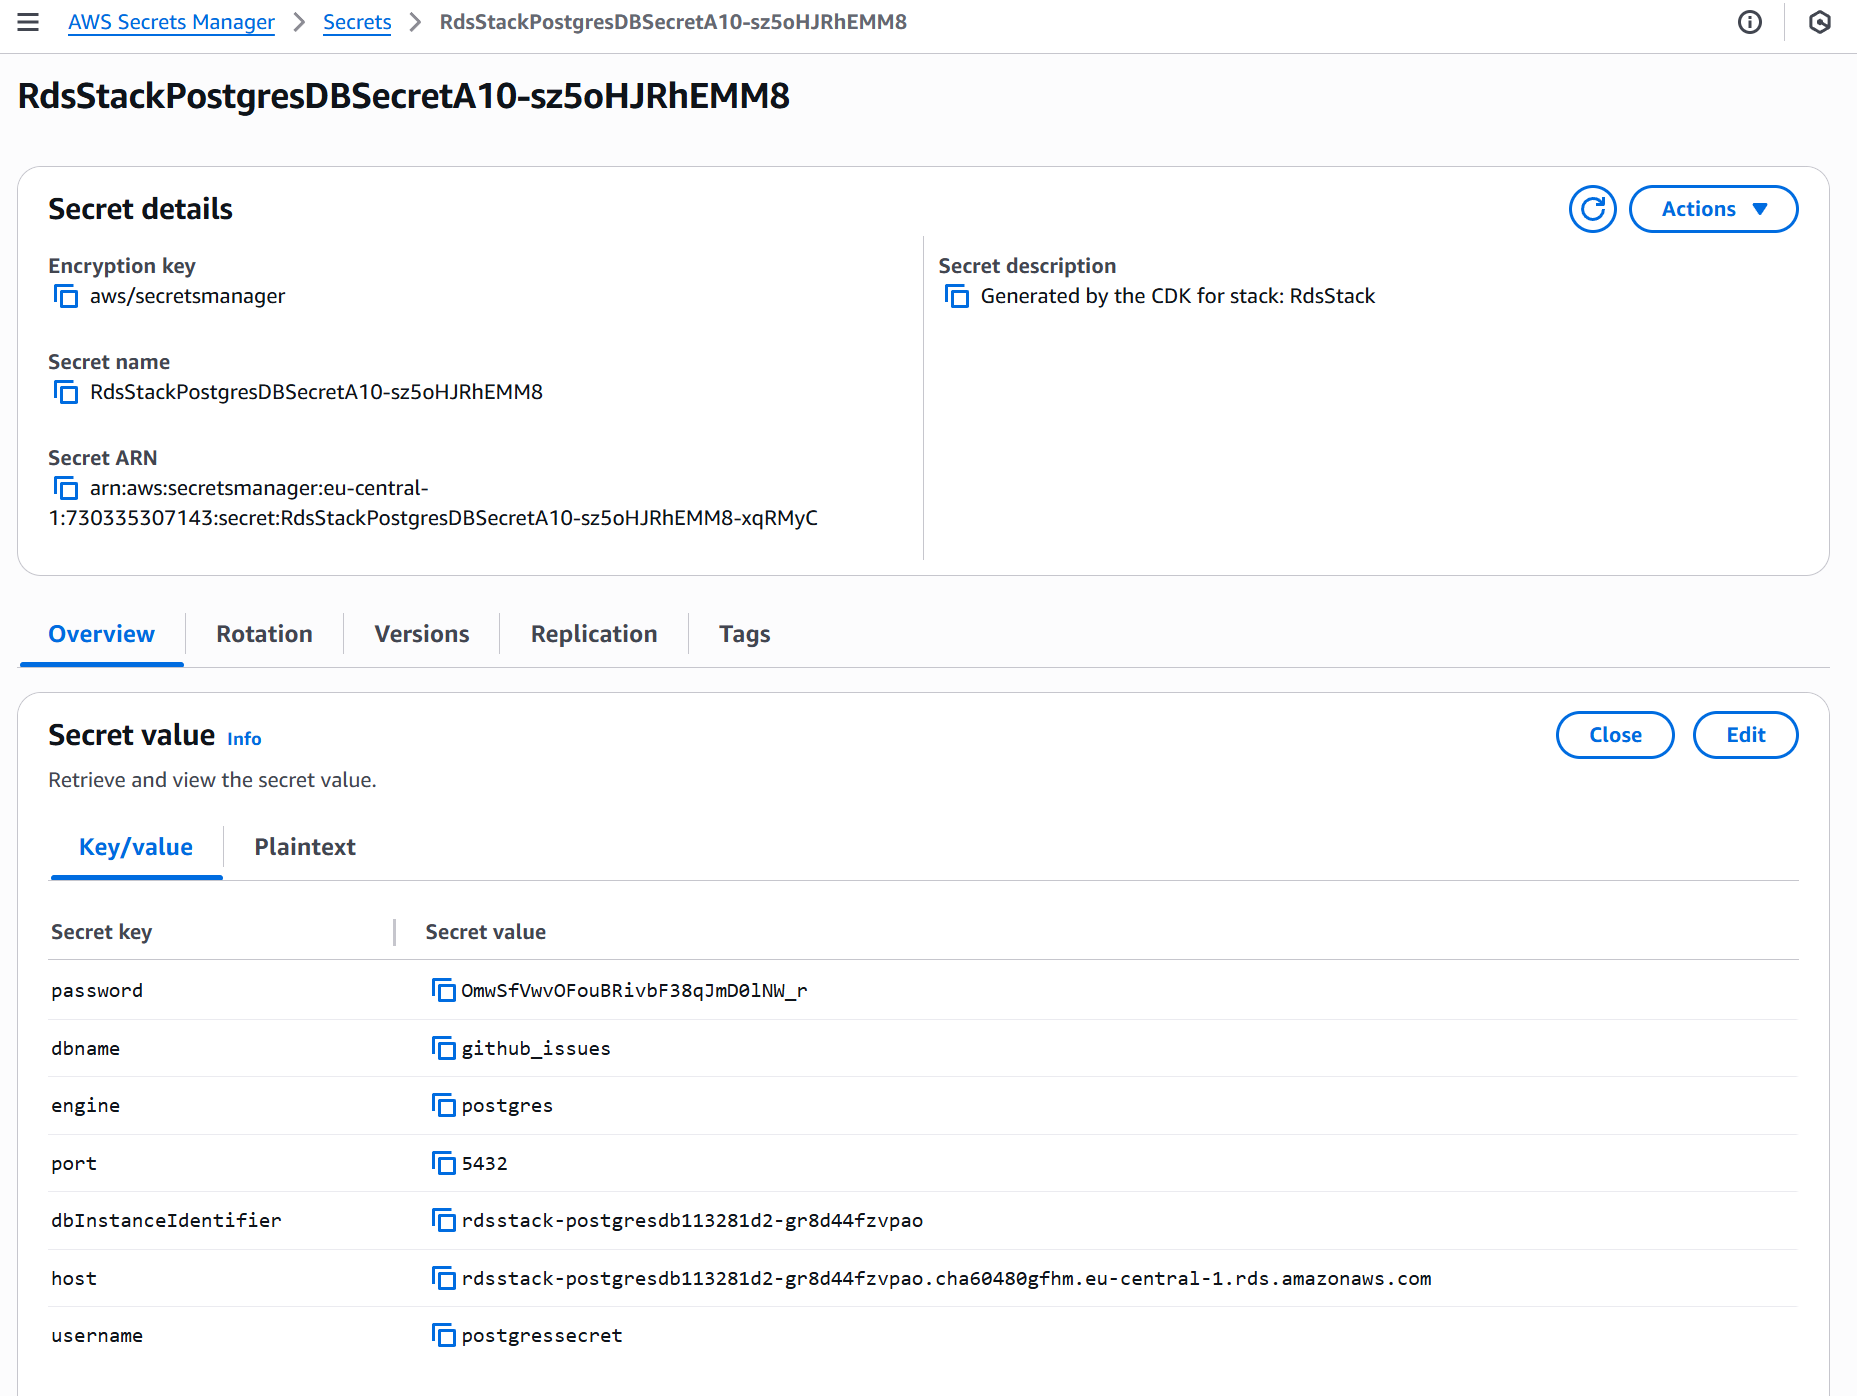
The RDSStack sets up a managed PostgreSQL database for storing GitHub issues and related data:
Creates a PostgreSQL instance in private subnets for security.
Uses AWS Secrets Manager to generate and manage database credentials automatically.
Restricts access with security groups to allow traffic only within the VPC and within the public IP.
Configures instance size to
BURSTABLE3.MICROfor cost efficiency.Enables backups with a 7-day retention policy.
Ensures the database is not publicly accessible.
Note that you can make access to the RDS completely private, but this would require ingesting the data from an EC2 instance inside the same VPC, which would generate additional costs. Making it public from your IP will allow for an easier interaction.
class RDSStack(Stack):
    def __init__(self, scope: Construct, id: str, vpc: ec2.Vpc, **kwargs: Any):
        super().__init__(scope, id, **kwargs)

        credentials = rds.Credentials.from_generated_secret(os.getenv("POSTGRES_USER"))

        security_group = ec2.SecurityGroup(
            self,
            "RDSSecurityGroup",
            vpc=vpc,
            description="Allow internal access to PostgreSQL",
            allow_all_outbound=True,
        )

        security_group.add_ingress_rule(
            peer=ec2.Peer.ipv4(vpc.vpc_cidr_block),
            connection=ec2.Port.tcp(5432),
        )

        # Allow access only from your specific IP (use your real public IP here)
        my_public_ip = os.getenv("MY_PUBLIC_IP")
        if my_public_ip:
            security_group.add_ingress_rule(
                peer=ec2.Peer.ipv4(f"{my_public_ip}/32"),
                connection=ec2.Port.tcp(5432),
                description="Allow external access to PostgreSQL from my IP"
            )
        else:
            raise ValueError("Environment variable MY_PUBLIC_IP is not set.")

        rds.DatabaseInstance(
            self,
            "PostgresDB",
            engine=rds.DatabaseInstanceEngine.postgres(version=rds.PostgresEngineVersion.VER_16_3),
            vpc=vpc,
            credentials=credentials,
            # vpc_subnets=ec2.SubnetSelection(subnet_type=ec2.SubnetType.PRIVATE_WITH_EGRESS),
            vpc_subnets=ec2.SubnetSelection(subnet_type=ec2.SubnetType.PUBLIC),
            security_groups=[security_group],
            database_name=os.getenv("POSTGRES_DB"),
            instance_type=ec2.InstanceType.of(ec2.InstanceClass.BURSTABLE3, ec2.InstanceSize.MICRO),
            allocated_storage=20,
            max_allocated_storage=100,
            # publicly_accessible=False,
            publicly_accessible=True,
            multi_az=False,
            backup_retention=Duration.days(7),
            removal_policy=RemovalPolicy.DESTROY,
        )
This managed RDS instance ensures persistent, reliable storage while abstracting away the underlying infrastructure management.
VPC Stack
The VPCStack is responsible for creating a custom Virtual Private Cloud (VPC) with public and private subnets, which serve as the foundational network layer for our infrastructure:
Defines a VPC spanning 2 availability zones for high availability.
Creates two types of subnets:
Public subnets for internet-facing resources.
Private subnets with egress for internal resources like databases and compute instances.
Uses a smaller CIDR block (
10.0.0.0/20) to efficiently allocate IPs without wasting resources.
class VPCStack(Stack):
    def __init__(self, scope: Construct, id: str, **kwargs: object) -> None:
        super().__init__(scope, id, **kwargs)

        # Define a VPC with smaller CIDR block and optimize for smaller-scale use cases
        self.vpc = ec2.Vpc(
            self,
            "SharedVPC",
            max_azs=2,  # 2 Availability Zones for fault tolerance, you can change to 3 for more resiliency
            ip_addresses=ec2.IpAddresses.cidr("10.0.0.0/20"),  # A smaller CIDR block (4,096 IP addresses)
            subnet_configuration=[
                ec2.SubnetConfiguration(
                    name="Public",
                    subnet_type=ec2.SubnetType.PUBLIC,
                    cidr_mask=24,  # This subnet will have 256 IP addresses
                ),
                ec2.SubnetConfiguration(
                    name="Private",
                    subnet_type=ec2.SubnetType.PRIVATE_WITH_EGRESS,
                    cidr_mask=24,  # This subnet will also have 256 IP addresses
                ),
            ],
        )
This modular network setup enables secure communication between services and isolates our database from public access while allowing pods in Kubernetes to communicate freely.
Deployment
To deploy the infrastructure, you need to move to the aws_cdk_infra folder and create an isolated virtual environment. Once done, you have to follow the next steps:
Install dependencies:
pip install -r requirements.txtBootstrap your AWS environment (if first time):
cdk bootstrap aws://<AWS_ACCOUNT_ID>/<AWS_REGION>Deploy the stacks:
cdk deploy --allThis will provision your VPC, EKS cluster with Fargate, and RDS PostgreSQL database in AWS, ready to host your containerized FastAPI app (the deployment might take up to 30 minutes to finish). You can find the provisioned Stack under AWS CloudFormation and the necessary secrets under AWS Secrets Manager. You would need to add to the .env.prod file the password, host, username, and secret name, as during development, you were running on localhost.
Once you adapt your .env.prod file, you can build your Dockerfile with the AWS CDK Stack. You must run the same commands as before but with APP_ENV=prod. This is applicable for creating the issues/comments tables, ingesting GitHub data, creating the Qdrant collection/index, and ingesting the embeddings:
# Docker
make docker-build APP_ENV=prod
make docker-up APP_ENV=prod

# PostgreSQL
make init-db APP_ENV=prod
make ingest-github-issues APP_ENV=prod

# Qdrant
make create-collection APP_ENV=prod
make create-indexes APP_ENV=prod
make ingest-embeddings APP_ENV=prod
NOTE: The following setup serves as the initial production environment and has been simplified to allow full IAM access and reduce complexity. As your application scales, you must enhance it with features like autoscaling policies, CI/CD pipelines, monitoring dashboards, and stricter security controls.
Kubernetes Cluster
Once you have deployed your AWS CDK infrastructure, your EKS cluster will be visible in the AWS Console. To interact with the cluster from your local machine, you need to configure your kubectl CLI.
When you install the Kubernetes CLI (kubectl), the configuration file is stored under ~/.kube/config. To add your EKS cluster to this configuration file, run the following command (replace placeholders accordingly):
aws eks --region <aus-region> update-kubeconfig --name <cluster-name>You can verify the configuration with:
kubectl config viewThis should display information about your cluster context, users, and settings.
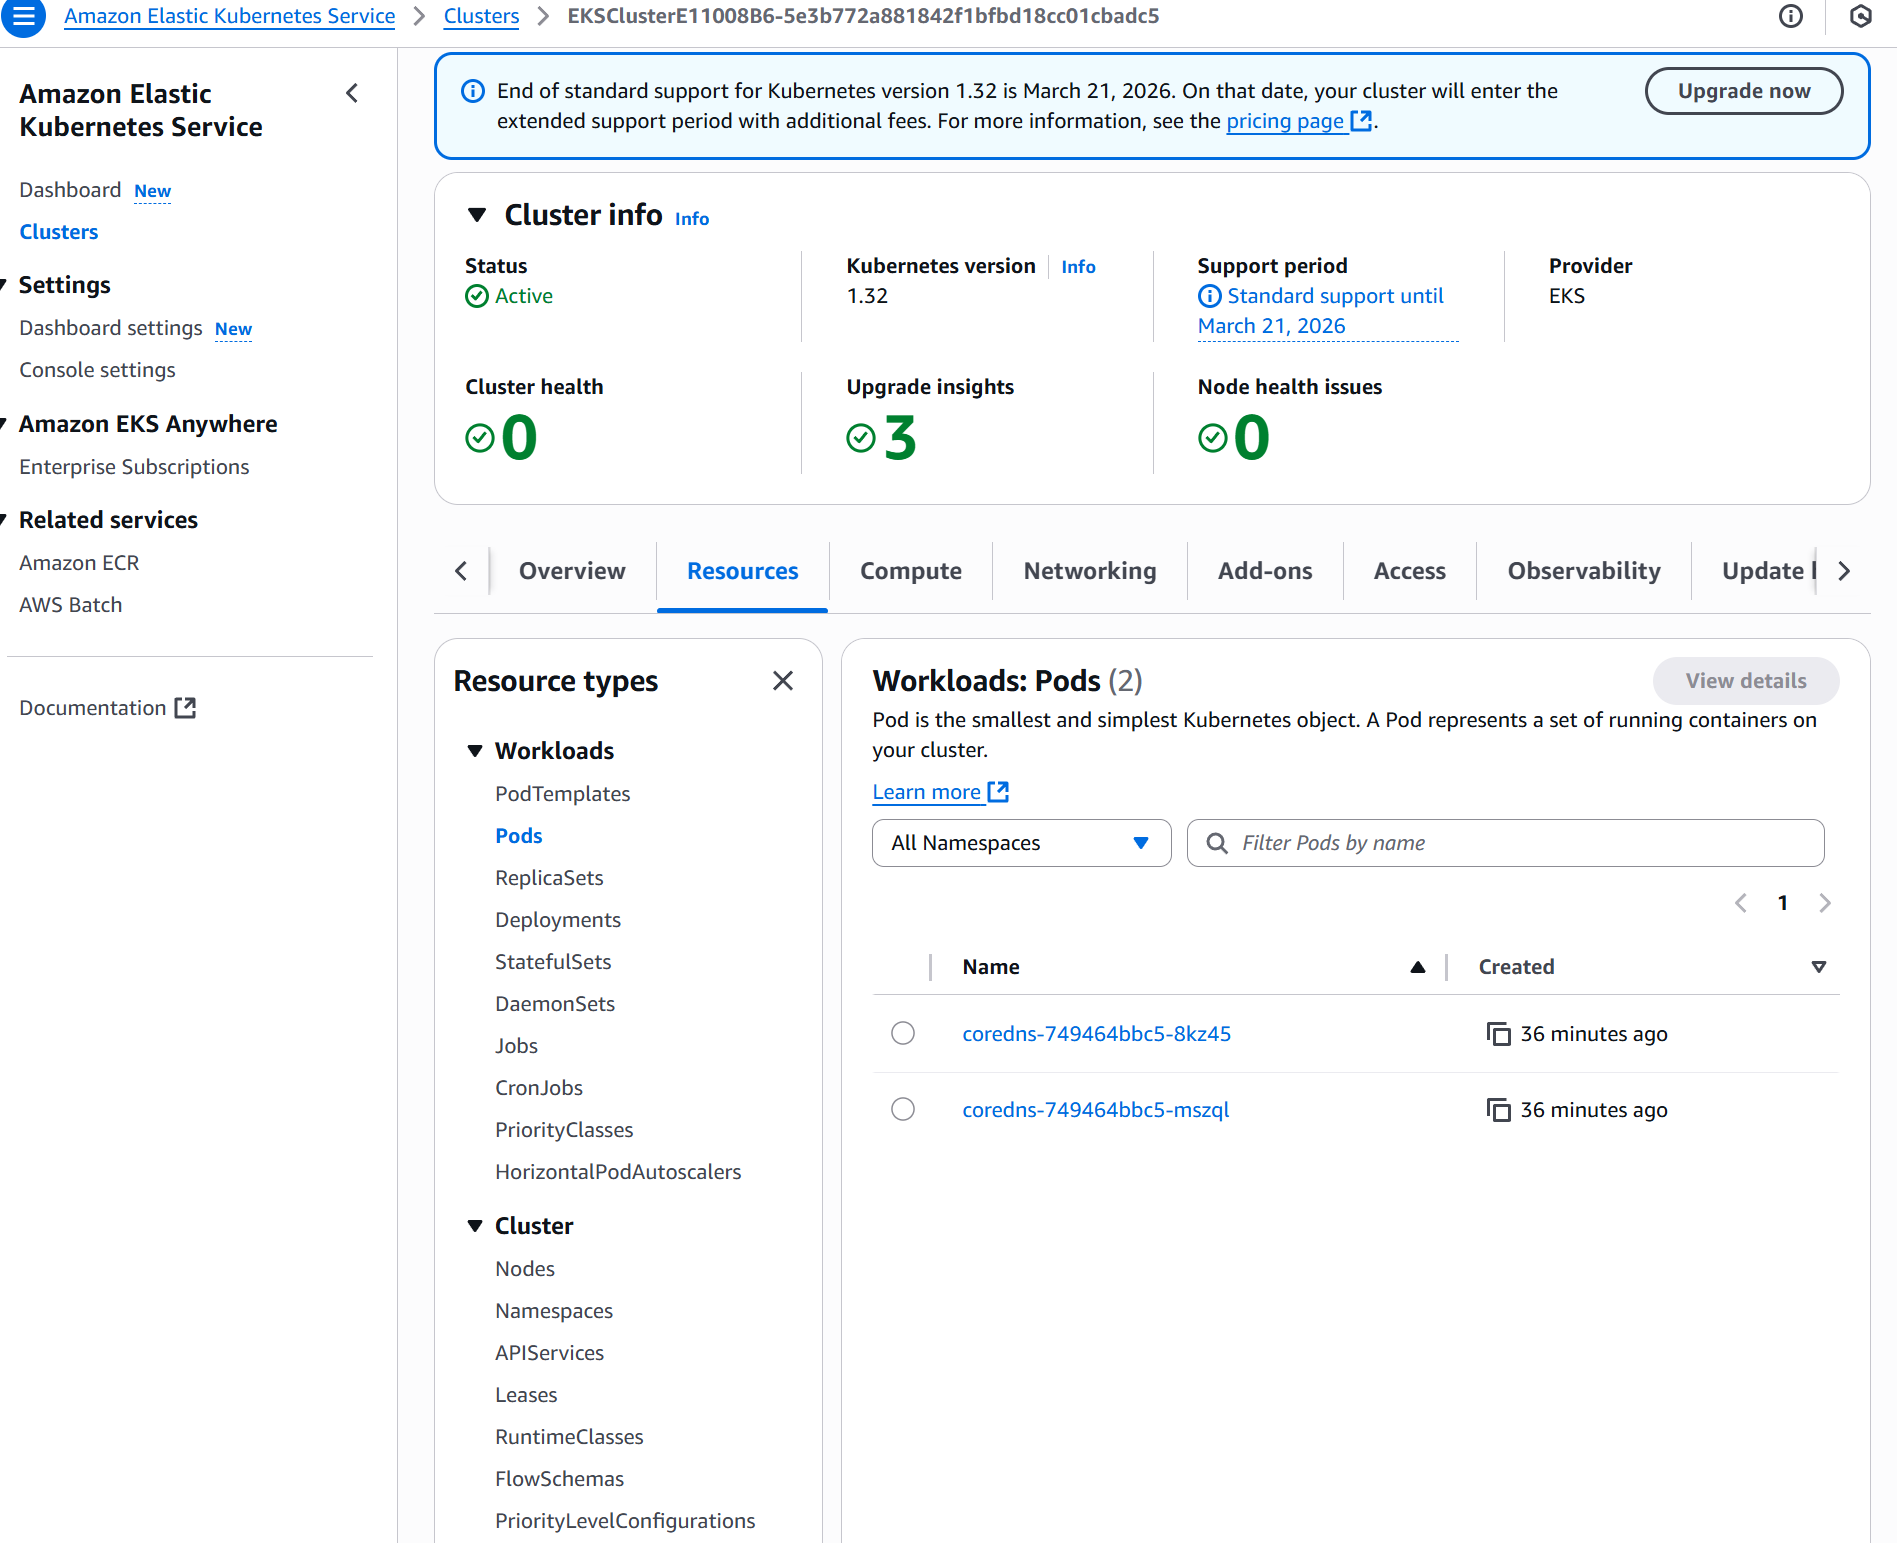
To verify that the core system components are running, list the pods in the kube-system namespace. Namespaces are a way to organize and isolate groups of resources within a single cluster. The namespace kube-system is the default one with the core pods that make the cluster work.
kubectl get pods -n kube-systemYou should see output similar to:
NAME                       READY   STATUS    RESTARTS   AGE
coredns-749464bbc5-8kz45   1/1     Running   0          23m
coredns-749464bbc5-mszql   1/1     Running   0          23m
If, for some reason, system pods are not running, you can delete them. Kubernetes will automatically recreate them:
kubectl delete pods --all -n kube-systemK9s UI
If you have installed K9s, you can interact with your cluster via a terminal-based UI. Simply run:
k9s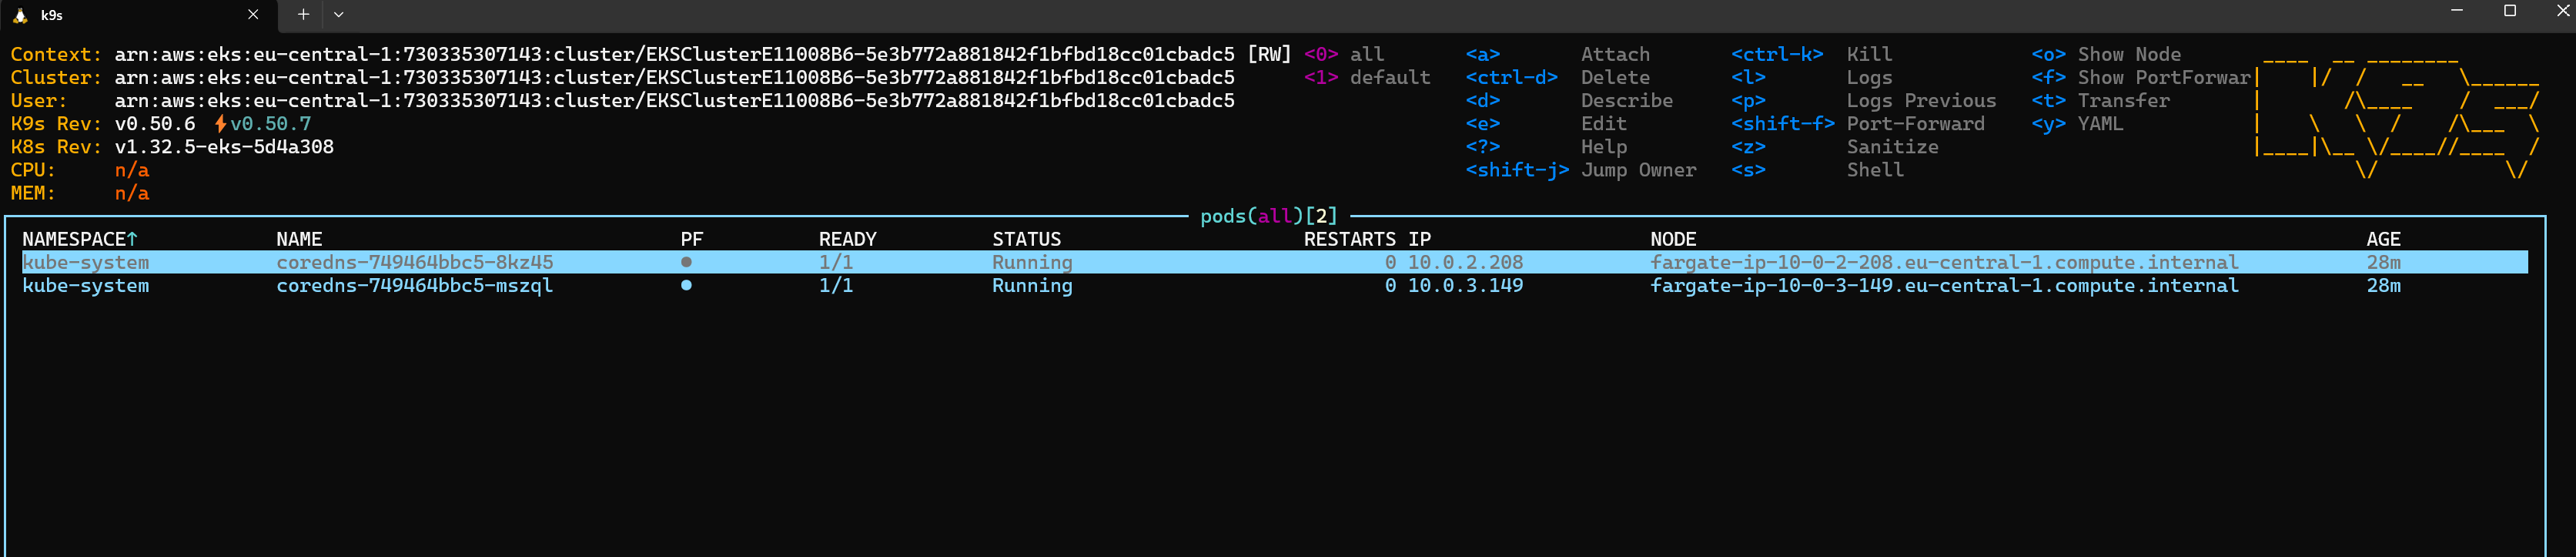
Useful commands in K9s:
Press “
Shift + :” to open the command bar.Type
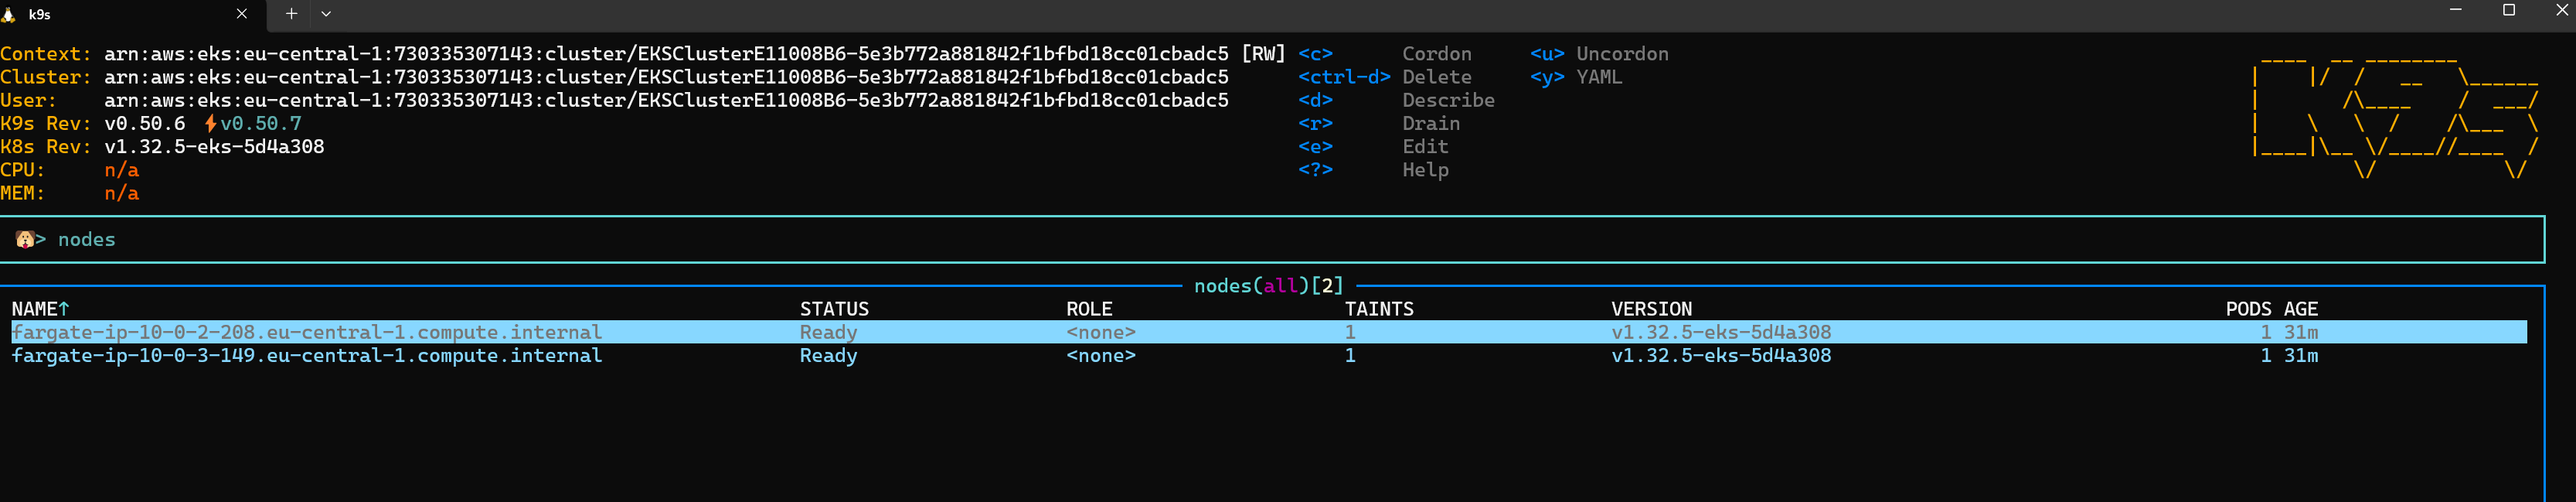
nodesto view Fargate serverless nodes.Use
Enterto drill into resources.Press
Escto go back to the previous screen.
While the UI might take a little time to get used to, it greatly simplifies navigation and debugging.
Kubernetes Manifests
Kubernetes uses YAML manifests to declaratively manage infrastructure and deployments. For the FastAPI application, you must define a deployment (the app) and a service (a load balancer to make requests from an external API)
├── kubernetes
│   ├── fastapi-deployment.yaml
│   ├── fastapi-service.yaml
Make sure to run this command before deploying the app as, as mentioned before, the app will run in a separate namespace.
kubectl create namespace my-appBefore deploying the app, you need to build and push your Docker image to an AWS ECR (Elastic Container Registry) repository, as now we will deploy to production and in the deployment manifest (see next chapter) will point to the image in the ECR Repository. Ensure that your image is built for production with the APP_ENV=prod, and just replace the placeholders with your AWS credentials.
aws ecr get-login-password --region eu-central-1 | docker login --username AWS --password-stdin <aws-account-id>.dkr.ecr.<aus-region>.amazonaws.com

aws ecr create-repository --repository-name fastapi-app --region <aus-region>

docker tag myapp-prod-image:latest <aws-account-id>.dkr.ecr.<aus-region>.amazonaws.com/fastapi-app:latest

docker push <aws-account-id>.dkr.ecr.<aus-region>.amazonaws.com/fastapi-app:latest
Configure Kubernetes Secrets & ConfigMaps
To provide environment variables and sensitive information to the application, use Kubernetes Secrets and ConfigMaps. ConfigMaps are for non-sensitive variables, while Secrets are sensitive information like passwords or API keys.
There are different ways to add the environment variables to the cluster. Ideally, this can be done during the AWS CDK deployment. Under the eks_stack.py script, you will find at the end of the file the possibility to add this to the cluster. You can uncomment the eks_cluster.add_manifest options and make sure to have the variables set up in the .env file. Then, run the following command to update the cluster.
cdk deploy EksStackAlternatively, you can do it through the terminal by creating a specific env file (or a manifest) and running the command below, pointing to that file.
kubectl create secret generic app-secrets \
  --from-env-file=secrets.env \
  -n my-app

kubectl create configmap app-config \
  --from-env-file=secrets.env \
  -n my-app
Also, it is possible to provide the values directly (which, for a proper production setup, is not recommended):
kubectl create configmap app-config \
                --from-literal=APP_ENV=prod \
                --from-literal=AWS_REGION= \
                --from-literal=POSTGRES_DB= \
                --from-literal=POSTGRES_PORT= \
                --from-literal=ADMINER_PORT= \
                --from-literal=ISSUES_TABLE_NAME= \
                --from-literal=COMMENTS_TABLE_NAME= \
                --from-literal=DENSE_MODEL_NAME= \
                --from-literal=SPARSE_MODEL_NAME= \
                --from-literal=LEN_EMBEDDINGS= \
                --from-literal=COLLECTION_NAME= \
                --from-literal=CHUNK_SIZE= \
                --from-literal=BATCH_SIZE= \
                --from-literal=CONCURRENT_COMMENTS= \
                --from-literal=LLM_MODEL_NAME= \
                --from-literal=TEMPERATURE= \
                --from-literal=REPOS_CONFIG=src/config/repos.yaml \
                --from-literal=GUARDRAILS_CONFIG=src/config/guardrails.yaml \
                -n my-app

kubectl create secret generic app-secrets \
                --from-literal=GH_TOKEN= \
                --from-literal=POSTGRES_USER= \
                --from-literal=POSTGRES_HOST=\
                --from-literal=POSTGRES_PASSWORD== \
                --from-literal=QDRANT_API_KEY= \
                --from-literal=QDRANT_URL= \
                --from-literal=LANGSMITH_API_KEY= \
                --from-literal=OPENAI_API_KEY= \
                --from-literal=GUARDRAILS_API_KEY= \
                --from-literal=SECRET_NAME= \
                -n my-app
Deploy the Application
Once the environment variables have been set up, you can deploy the application by applying the deployment manifest. Below is a short snippet of the file. It contains a reference to all variables and the Docker image that have been previously pushed to the AWS ECR repository. Having 3 replicas allows you to keep the application running with some safety margin.
apiVersion: apps/v1
kind: Deployment
metadata:
name: fastapi-deployment
namespace: my-app
spec:
replicas: 3
selector:
matchLabels:
app: fastapi
template:
metadata:
labels:
app: fastapi
spec:
containers:
- name: fastapi
image: 730445307583.dkr.ecr.eu-central-1.amazonaws.com/fastapi-app:latest
ports:
- containerPort: 8000
env:
# Non-sensitive env variables from ConfigMap
- name: APP_ENV
valueFrom:
configMapKeyRef:
name: app-config
key: APP_ENV
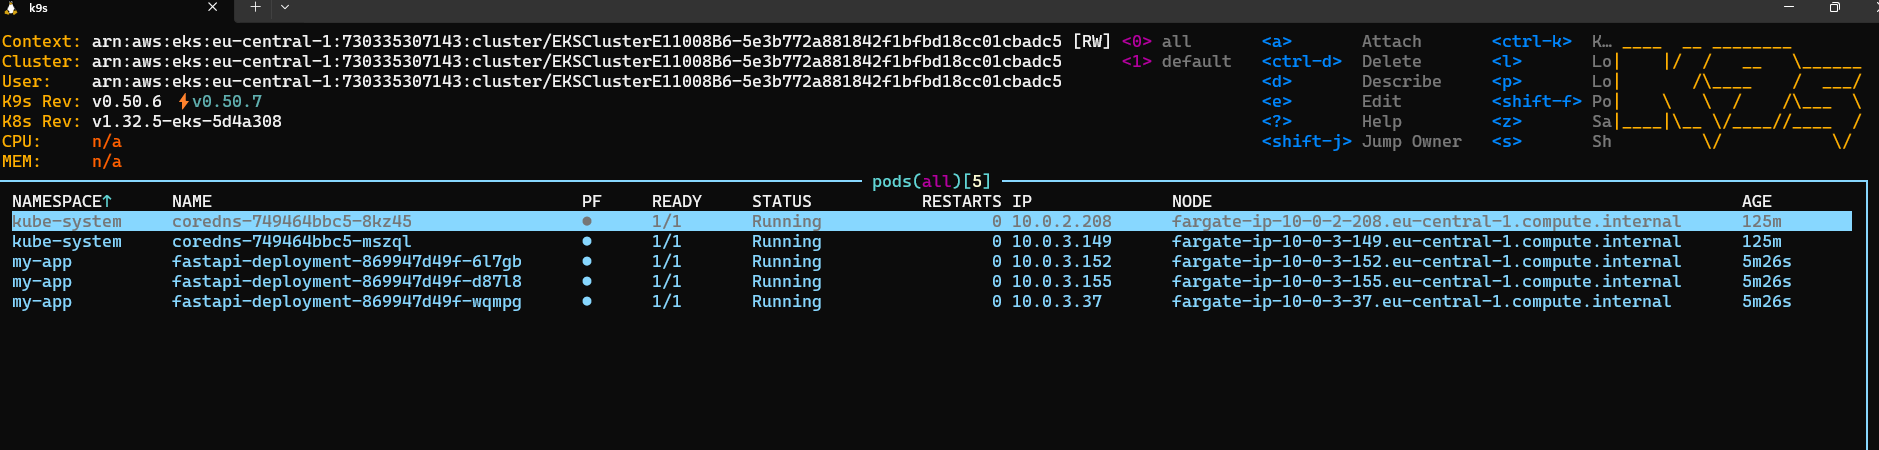
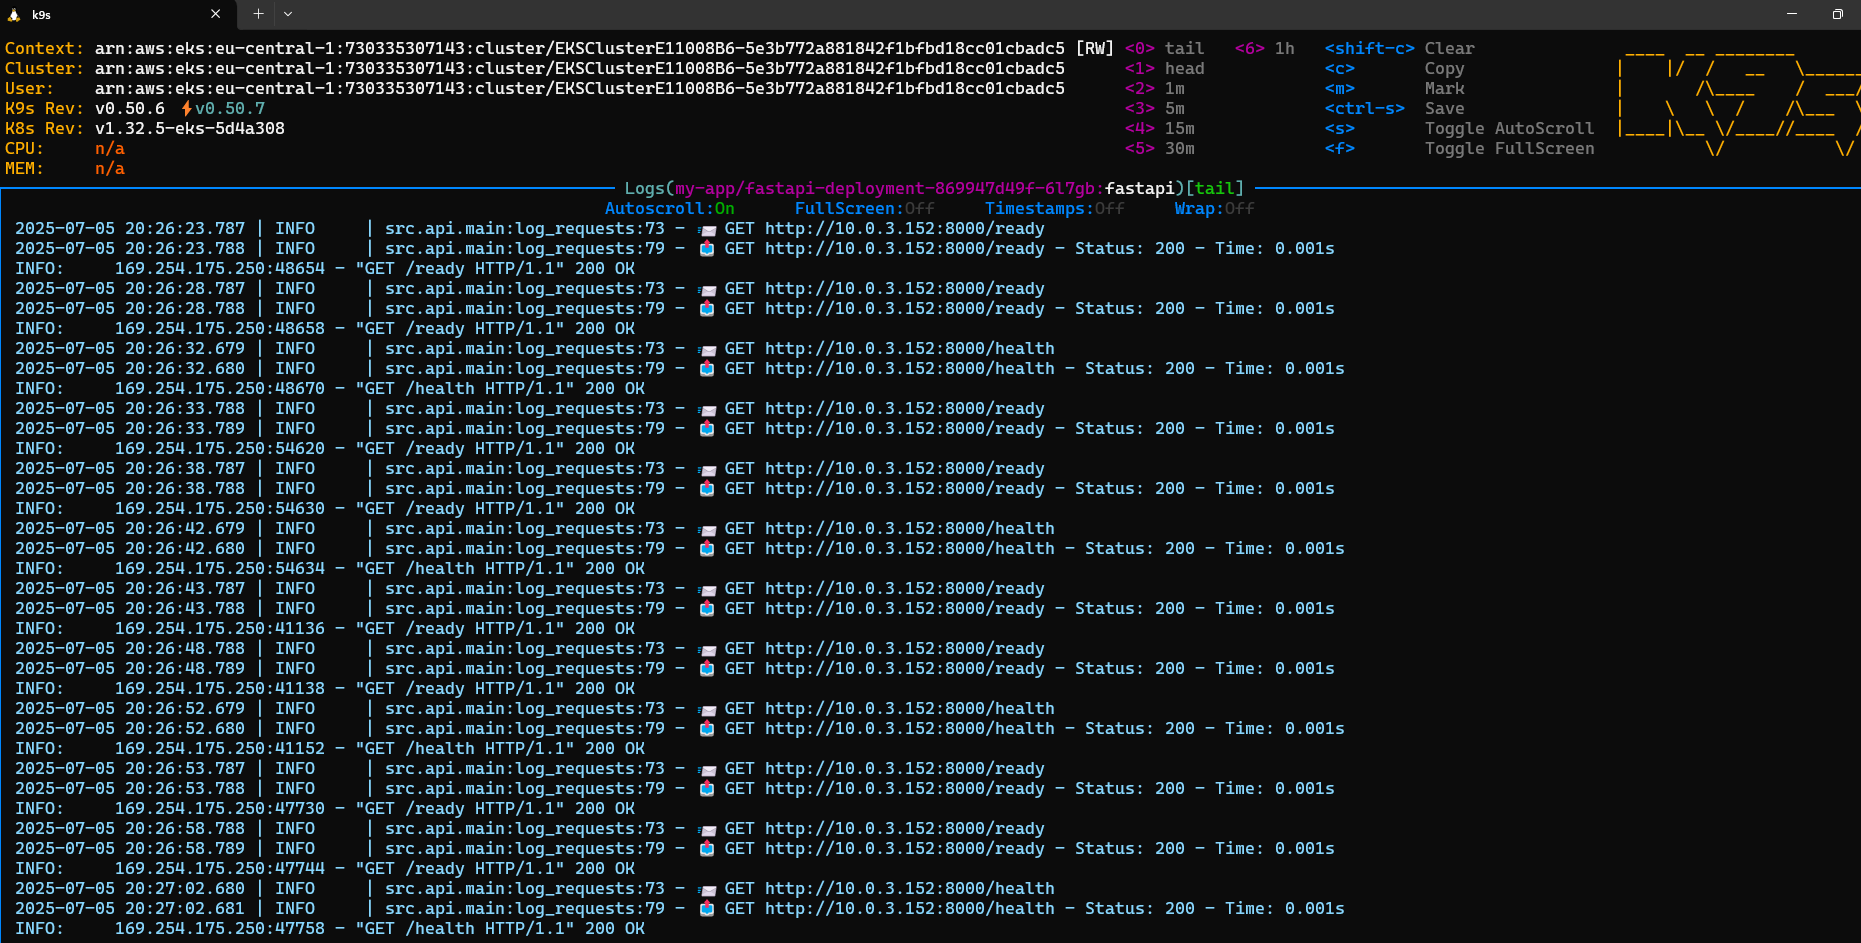
- name: AWS_REGIONkubectl apply -f fastapi-deployment.yamlAfter applying the manifest, you should see the application pods, and if you enter one of them, all health/ready checks shall be ok.
Now you can try locally to send a request from the terminal. If everything has been set up properly, you shall get a reply.
curl -X POST "http://localhost:8000/process-issue" \
-H "Content-Type: application/json" \
-d '{
"title": "Test Issue",
"body": "Test Issue"
}'
Load Balancer
If you want to route internet traffic, you can install the AWS Load Balancer Controller that enables your EKS cluster to provision external IPs via AWS-managed Elastic Load Balancers (ELB) when using Service or Ingress resources.

You must follow the steps outlined here in this link. Just make sure you add your VPC ID, which you can find in the AWS Console or by running this command in the terminal.
aws eks describe-cluster --name <your cluster name> --query "cluster.resourcesVpcConfig.vpcId" --output textIf everything is set up properly, the load balancer must be visible under deployments.
kubectl get deployment -n kube-system aws-load-balancer-controller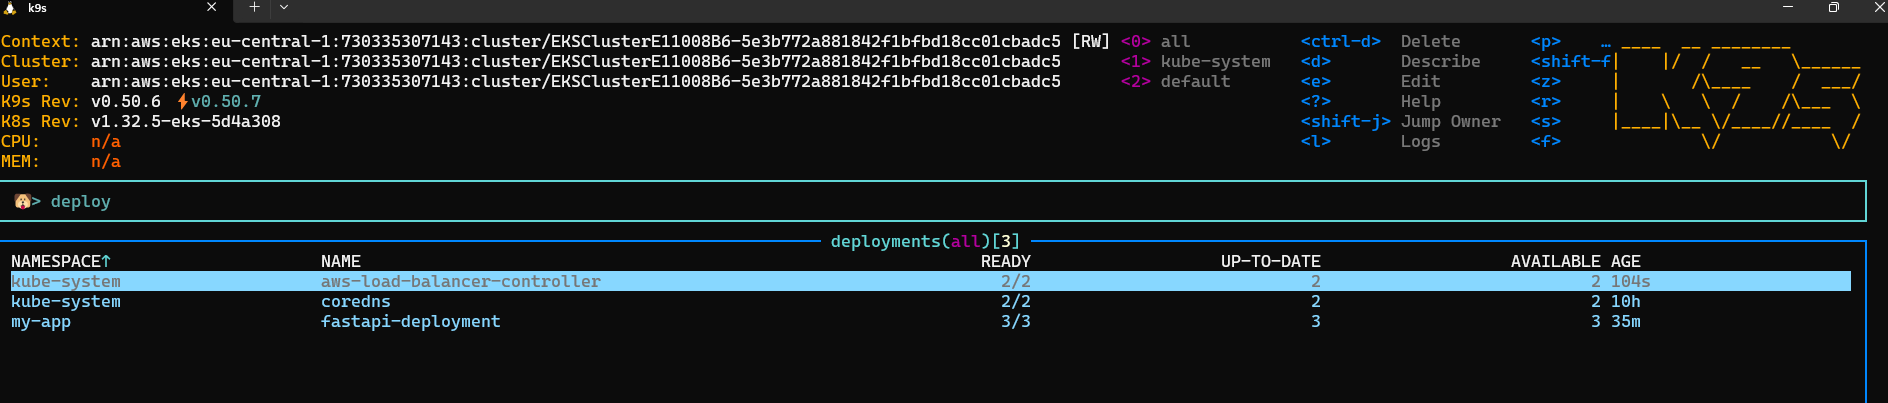
The final step is to apply a LoadBalancer service to our app. This will provide us with an external IP address that we can use to send requests to the application.
apiVersion: v1
kind: Service
metadata:
  name: fastapi-external
  namespace: my-app
  annotations:
    service.beta.kubernetes.io/aws-load-balancer-type: "nlb"
    service.beta.kubernetes.io/aws-load-balancer-scheme: "internet-facing"
    service.beta.kubernetes.io/aws-load-balancer-cross-zone-load-balancing-enabled: "true"
    service.beta.kubernetes.io/aws-load-balancer-nlb-target-type: "ip"
    my-app.com/description: "FastAPI external service"

spec:
  selector:
    app: fastapi
  ports:
    - name: http
      protocol: TCP
      port: 80
      targetPort: 8000
  type: LoadBalancer
kubectl apply -f fastapi-service.yaml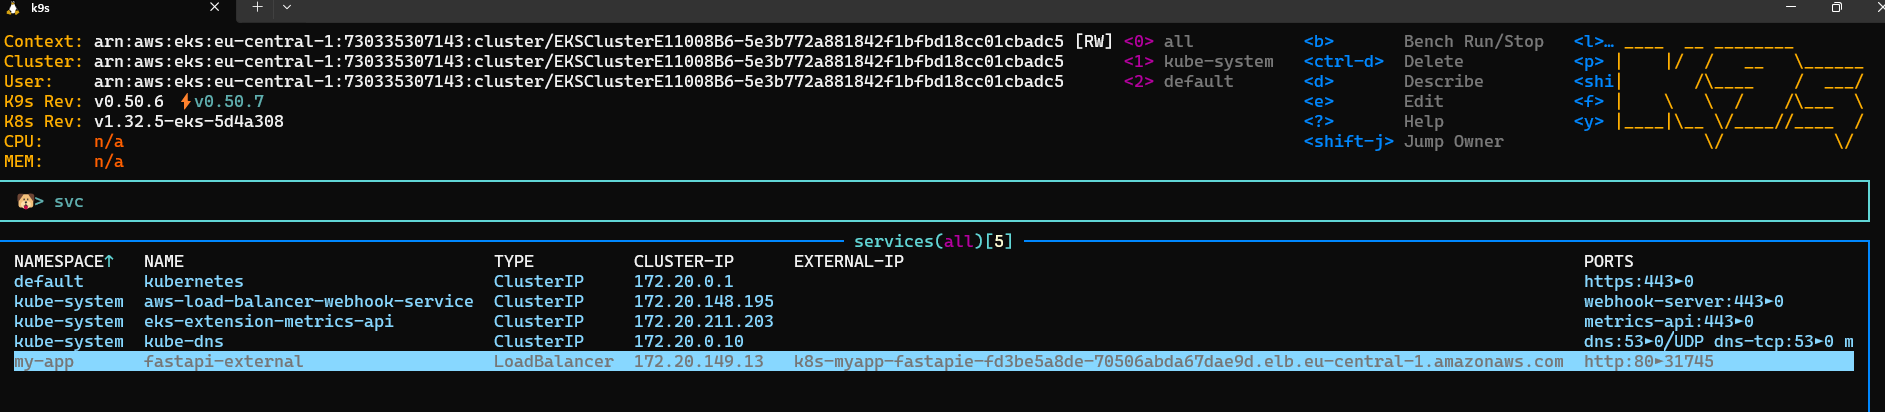
kubectl get svc -n my-appNAME TYPE CLUSTER-IP EXTERNAL-IP PORT(S) AGE
fastapi-external LoadBalancer 172.20.149.13 k8s-myapp-fastapie-fd3be5a8de-70506abda67dae9d.elb.eu-central-1.amazonaws.com 80:31745/TCP 85s
If you try now to make this request from an external device, you shall get an answer.
curl -X POST "http://k8s-myapp-fastapie-fd3be5a8de-70506abda67dae9d.elb.eu-central-1.amazonaws.com/process-issue" \
-H "Content-Type: application/json" \
-d '{
"title": "Test Issue",
"body": "Test Issue"
}'
Clean Up
Do not forget to destroy the AWS CDK stacks when you are done. Keeping this running may cost approximately $5-10/day. The following command will delete all stacks (and might take up to 30 minutes). Additionally, you shall delete the AWS ECR repository.
cdk destroy --allOnce this is done, make sure there are no running resources by checking the AWS Console and going through the following resources:
AWS CloudFormation
AWS EKS
AWS RDS
AWS Secrets Manager
EC2 Load Balancers
AWS VPC
If any resources remain there, you can always delete them manually in the AWS Console.
Conclusion
Managing issues in large-scale GitHub repositories demands more than just basic automation. It requires intelligent, scalable, and safe decision-making. This project demonstrates how a multi-agent system powered by LangGraph, LLMs, vector databases, and cloud-native tooling can provide a comprehensive solution to that challenge.
By orchestrating specialized agents, each handling a different aspect of issue triage, such as validation, semantic search, classification, and recommendation, the system not only streamlines developer workflows but also ensures higher consistency, contextual relevance, and operational safety. The use of PostgreSQL and Qdrant allows for both structured and semantic insights, while Guardrails AI guarantees the integrity of LLM interactions.
Additionally, the deployment stack built with AWS CDK and Kubernetes provides a robust, production-grade foundation that is fully reproducible and ready to scale. With Docker-based development, configurable pipelines, and modular architecture, this system serves as a practical blueprint for integrating AI-powered agents into real-world developer infrastructure.
See you next week.
👋 We’d love your feedback to help improve Decoding ML.
Share what you want to see next or your top takeaway. I read and reply to every comment!
👏 If you enjoyed reading this content, you can support me by following me on Substack, Medium, or Dev, where I publish my articles!
Whenever you’re ready, there are 3 ways we can help you:
Perks: Exclusive discounts on our recommended learning resources
(books, live courses, self-paced courses and learning platforms).
The LLM Engineer’s Handbook: Our bestseller book on teaching you an end-to-end framework for building production-ready LLM and RAG applications, from data collection to deployment (get up to 20% off using our discount code).
Free open-source courses: Master production AI with our end-to-end open-source courses, which reflect real-world AI projects and cover everything from system architecture to data collection, training and deployment.
Images
If not otherwise stated, all images are created by the author.
 | A guest post by
|
Thanks for publishing! I hope people like it and learn from it! 😎