


Paul: Today, the scene is owned by Jason Liu, a brilliant mind who spent over a decade building AI systems at Facebook, Stitch Fix, and consulting for companies funded by Sequoia, a16z, and Y Combinator.
He runs a course on Systematically Improving RAG Applications, teaching the production-ready RAG framework trusted by engineers from OpenAI, Anthropic, Google and others.
Enough talking, I’ll let him dig into today’s topic: “a 7-step playbook to improve your RAG system systematically” ↓🎙️ Enjoy!
Jason: I've spent over a decade building AI systems, from recommendation systems that drove $50M in revenue to content safety systems processing millions of items.
This systematic approach has been refined through countless implementations. It has been so successful that engineers at companies like Anthropic, OpenAI, Google, Microsoft, PwC, Bain & Company, Booz Allen Hamilton, and hundreds of other leading organizations take my course to get caught up as they learn AI engineering.
The Problem That Started It All
I'll never forget the panic in the engineering director's voice during our onboarding call. "Our RAG system worked in demos," he said, "but now that it's in production, users are complaining that it can't answer basic questions about our own documentation. We've tried three different embedding models and tweaked our prompts dozens of times. Nothing helps. I don't feel good about launching this to all our customers."
The fundamental issue? Everyone was treating RAG as a one-time implementation project rather than an evolving product. They'd optimize for the wrong metrics, guess at solutions, and make random changes, hoping something would stick.
The Two Biases That Kill RAG Projects
Behind these surface-level mistakes lie two fundamental biases that kill more RAG projects than anything else:
Absence Bias (Absence Blindness)
You can't fix what you can't see. Sounds obvious, right? But I see teams obsess over generation quality while completely ignoring whether retrieval works at all.
I had a client spend three weeks fine-tuning prompts. When we finally checked, their retrieval system was returning completely irrelevant documents. No amount of prompt engineering can fix that.
Questions teams forget to ask:
Is retrieval actually finding the right documents?
Are our chunks the right size?
Is our data extraction pipeline working?
Do we have separate metrics for retrieval vs generation?
Intervention Bias
This is our tendency to do something just to feel like we're making progress. In RAG, it shows up as constantly switching models, tweaking prompts, or adding features without measuring impact.
Should we use GPT-4 or Claude? Maybe a new embedding model? What about chunking?
Will this new prompt technique help? I read on Arxiv that this new prompt technique is the best...
The solution? Resist the hype. Start from real data, measure carefully, do simple experiments, and only keep what actually helps.
✒️ "You Can't Manage What You Can't Measure"
This classic management principle applies perfectly to RAG systems. Without proper measurement, you're flying blind—making changes based on hunches rather than data. The teams that succeed are the ones who measure everything: retrieval quality, generation accuracy, user satisfaction, and system performance.
My Systematic RAG Playbook
This is my systematic approach to making RAG applications better. It's a step-by-step guide that will help you improve your RAG systems over time.
By the end of this post, you'll understand my systematic approach to making RAG applications better. This approach follows a continuous improvement cycle:
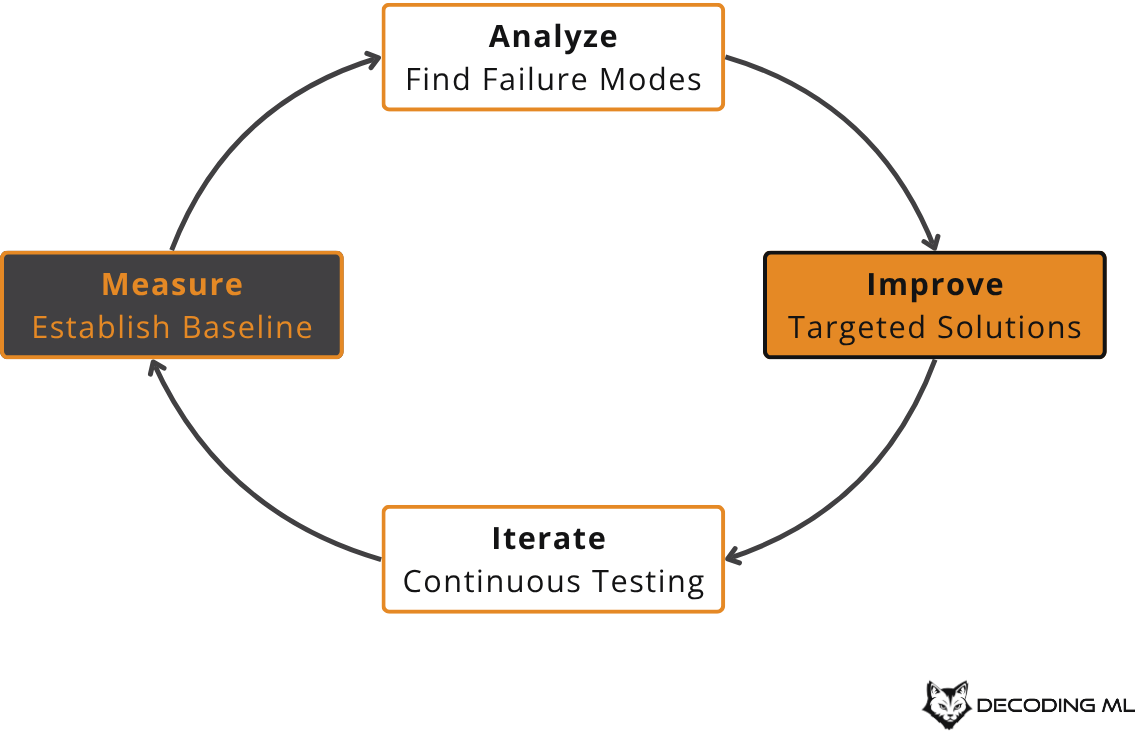
We'll implement this cycle through key areas like:
Making fake questions and answers to quickly test how well your system works
Using both full-text search and vector search together for the best results
Setting up the right ways to get feedback from users about what you want to study
Using grouping to find sets of questions that have problems, sorted by topics and abilities
Building specific systems to improve abilities
Constantly checking and testing as you get more real-world data
Through this step-by-step runbook, you'll gain practical knowledge on how to incrementally enhance the performance and utility of your RAG applications, unlocking their full potential to deliver exceptional user experiences and drive business value. Let's dive in and explore how to systematically improve your RAG systems together!
1) Start with Synthetic Data and Fast Retrieval Evals
Here's a brutal truth: most teams spend months fine-tuning prompts without ever measuring if their retrieval system actually works. When they finally check, they discover their systems retrieve the correct documents only 30-40% of the time.
No amount of prompt engineering can fix retrieving the wrong information.
Synthetic data is your escape hatch. It lets you evaluate your system before you have real users, so you can fix the fundamentals and avoid embarrassing mistakes.
How to Create Synthetic Data
For each text chunk in your database, generate a set of synthetic questions that this text chunk answers using an LLM.
Use these questions to test your retrieval system.
Calculate precision and recall scores to establish a baseline.
Identify areas for improvement based on the baseline scores.
What is Recall? Recall measures how many of the relevant documents your system actually found. If there are 10 relevant documents for a query and your system only found 7 of them, your recall is 70%. In RAG systems, missing relevant documents is often worse than finding some irrelevant ones, so recall is usually the more critical metric.
What we should be finding with synthetic data is that synthetic data should just be around 80-90% recall. And synthetic data might just look like something very simple to begin with.
A straightforward approach is to generate synthetic questions for each text chunk in your own dataset, then check if your system can retrieve the correct chunk for each question. You might expect this to always work, but that's not the case.
When I tested this with Paul Graham essays, both full text search and embedding search performed about the same, but full text search was roughly ten times faster. However, when I ran the same test on GitHub issues, full text search only achieved about 55% recall, while embedding search reached around 65%. This is a big drop in performance. Seeing how tough these questions are at the baseline is the first thing that tells you how much room there is for improvement and what kinds of experiments you should try next.
💬 "Agentic Persistence"
The best coding agents today have topped the SWE-Bench leaderboards using basic tools like grep and find, instead of fancy embedding models. Why does this work? Because agent persistence makes up for simpler tools—they keep searching and trying different strategies until they succeed. As a result, traditional metrics like embedding quality don't always predict how well an agent-based system will perform from start to finish.
You don't always need an agentic RAG system. In many cases, a straightforward search tool is faster to build, costs less to run, and is much simpler to maintain. For instance, a semantic search can often answer a question in a single API call, while an agentic RAG system using basic tools might need to take 15 separate steps to get the same answer.
Why Synthetic Data Enables Everything Else
Here's the crucial insight: synthetic data serves as the foundation that makes all other improvements possible.
Without synthetic data, you're flying blind:
You can't measure if metadata filtering actually helps (step 2)
You don't know if hybrid search is worth the complexity (step 3)
You have no baseline to measure feedback improvements against (step 4)
You can't quantify trade-offs between speed and accuracy (step 7)
With synthetic data, you become systematic:
Test changes before deploying them
Quantify improvements with real numbers
Make informed decisions about complexity vs. benefit
Build confidence in your system before users see it
This is why we start here. Every other step in this playbook depends on having reliable metrics. Synthetic data gives you those metrics from day one, creating the foundation for systematic improvement rather than random changes.
2) Utilize Metadata
Now that you have reliable evaluation metrics from step 1, you'll quickly discover that many user queries fail because they need information that text search simply can't provide.
Your users ask questions that pure text search can't answer:
"What's the latest version of our API?"
"Show me documents from last quarter."
"Who owns this project?"
"What changed in the November release?"
Metadata bridges this gap. It's the structured information that makes your documents searchable beyond just their text content.
The Metadata Problem
Without metadata, even a perfect semantic search fails on temporal and categorical queries. When someone asks "What are recent developments in machine learning?", your system needs to understand:
What "recent" means (last 6 months? year?)
Which sources are authoritative for ML content
How to filter by publication date
Text search can't solve this. Vector search can't solve this. You need structured metadata combined with query understanding.
Types of Metadata That Matter
Document-Level Metadata:
Temporal: Creation date, last updated, version number
Authorship: Author, team, department, reviewer
Categorical: Document type, status, priority, tags
Structural: Section, chapter, page number, hierarchy
Content-Level Metadata:
Source: Original system, database, file path
Quality: Review status, confidence score, freshness
Access: Permissions, visibility, sensitivity level
Relationships: Parent document, related files, dependencies
Improving Search Performance with Metadata
Consider giving a language model a tool like:
def search(query: str):
    ...
versus implementing a tool like:
def search(
    query: str,
    start_date: str | None = None,
    end_date: str | None = None,
    content_type: Literal["docs", "blog", "news"] | None = None,
    page_id: str | None = None,
    author: str | None = None,
):
    ...
Building something as specialized as this could really improve search performance by allowing the language model to take more context.
This has become more and more feasible as function calling and other tools become much more powerful. You can just have arguments that include start dates and end dates and do quite well. But what this still means is you need to index things correctly with the relevant metadata.
Improving Chunks with Metadata
Another way to use metadata is by including it directly in each text chunk. For example, compare these two prompt templates:
context = """

Here is the context, use this to answer the question.

{context}

Question: {question}
"""
Now compare this with a more advanced prompt template that includes richer metadata and context:
context = """
Below is the context you should use to answer the question.

<context>
{% for chunk in chunks %}
<chunk
    source="{chunk.source}"
    page_id="{chunk.page_id}"
    author="{chunk.author}"
    date="{chunk.date}">
{chunk.text}
</chunk>
{% endfor %}
</context>

<question>
{question}
</question>

When answering, always cite the page_id and source for any information you use. You can also make follow-up queries that filter by source, author, or page, and you can request to read the next or previous page if needed.
"""
and by designing a search function that can take advantage of this richer context:
def search(
    query: str,
    author: str | None = None,
    page_id: str | None = None,
    source: str | None = None,
):
    ...
Now, the context we expose when representing each chunk can also be used to make subsequent search calls even more specific, allowing for an agentic RAG to take advantage of this looping behavior. This is especially powerful when you persist metadata and context alongside your chunks, so that every search and retrieval step can leverage this stored information for even more targeted and accurate results.
3) Use Both Full-Text Search and Vector Search
With metadata extraction in place, you're ready to tackle the fundamental search layer. You now have structured data to filter on, but you still need to decide how to actually find the right documents.
The RAG community loves to debate: "Should I use full-text search or vector search?"
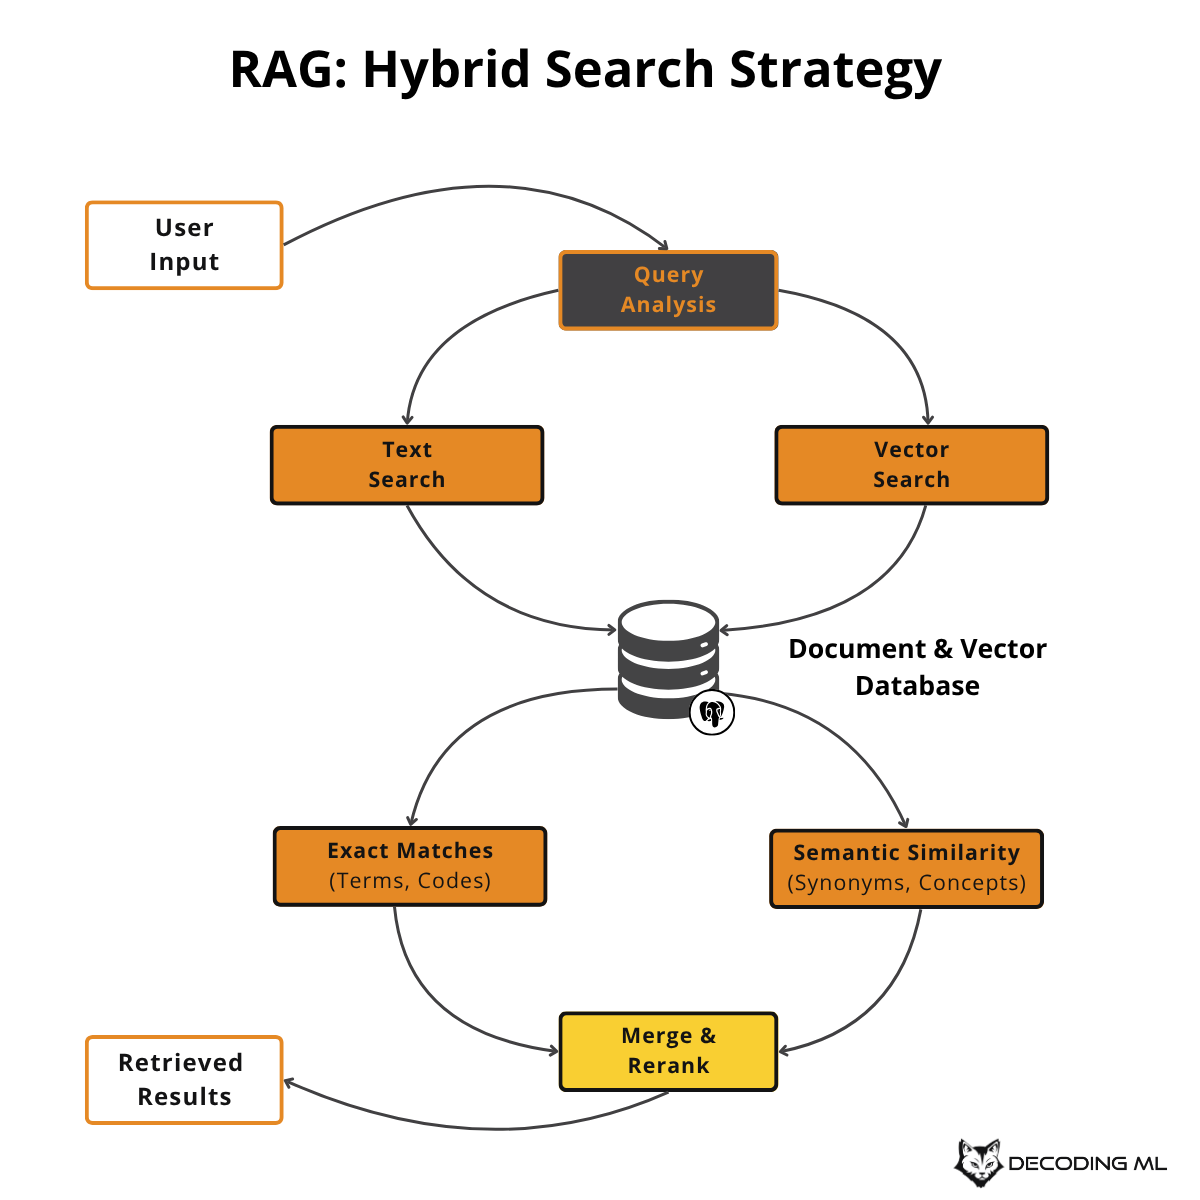
Here's the secret: use both. They solve different problems, and the best RAG systems combine them intelligently.
Full-text search finds exact matches and handles technical terms. Vector search understands meaning and context. Together, they cover the full spectrum of what users actually ask.
Understanding the Differences
Full-Text Search (Lexical Search):
Uses traditional information retrieval techniques like BM25 scoring
Excels at exact matches for product codes, names, and specific phrases
Handles technical terms and abbreviations that embedding models might miss
Provides efficient filtering and metadata aggregation
Works well with Boolean logic and structured queries
Much faster for simple keyword searches
Vector Search (Semantic Search):
Converts text into embedding vectors that capture meaning
Finds semantically similar content even when exact words don't match
Handles synonyms and different ways of expressing the same concept
Better at understanding context and intent
Can process complex, contextual queries
More effective for conceptual and exploratory searches
Okay, so which one do I use?
It depends on your data. This is why you created synthetic data in the first place. Don't take my word. Set up evals and check whether or not semantic search is worth the 10x greater latency than full text search based on the recall. If you get a 1% improvement with 10x latency, maybe it's not worth it. If you get a 15% improvement in recall, maybe it is. It's up to you to solve the problem.
4) Implement Clear User Feedback Mechanisms
Your synthetic evaluation suite from step 1 tells you how well your system works in theory. But real users have different patterns, edge cases, and expectations that synthetic data can't capture. This is where feedback collection becomes crucial.
Most RAG systems get feedback rates below 1%. Users don't tell you what's wrong because you're not asking the right questions at the right time.
Good feedback collection is the difference between a system that stagnates and one that improves every week. Without it, you're flying blind, unable to identify what's working and what needs fixing.
The Feedback Copy Problem
Here's something that took me way too long to figure out: the words you use for feedback collection matter more than you think.
I worked with a customer support RAG system that was getting terrible feedback rates. Their UI had a generic "How did we do?" with thumbs up/down buttons. Less than 0.5% of users engaged with it.
We changed one thing: the copy. Instead of "How did we do?" we asked "Did we answer your question correctly?"
Result: Feedback rates jumped from 0.5% to 8.2%. Same system, same UI, different words.
Feedback That Actually Helps
High-Impact Feedback Copy:
✅ "Did we answer your question correctly?"
✅ "Was this information helpful for your task?"
✅ "Did we find the right documents?"
❌ "How did we do?"
❌ "Rate your experience"
Domain-Specific Examples:
Code assistants: "Did this code solve your problem?"
Legal research: "Did we find the relevant cases?"
Technical docs: "Did this help you complete your task?"
The key is focusing on your core value proposition, not generic satisfaction.
The Confounding Variables Problem
Early on, we made a classic mistake. We'd get a thumbs down and assume the answer was wrong. But when we dug deeper, we found users were giving negative feedback for different reasons:
The answer was correct, but the tone was too formal.
Information was correct, but it took too long to load.
Content was accurate but poorly formatted.
The system was right, but required too many follow-up questions.
This taught us to be surgical about what we're measuring. We started asking: "Did we answer the question correctly? Yes or no." Everything else—tone, speed, format—would be separate improvements.
Building Your Improvement Loop
The goal is to turn feedback into improvements. Here's the systematic loop that creates continuous improvement:
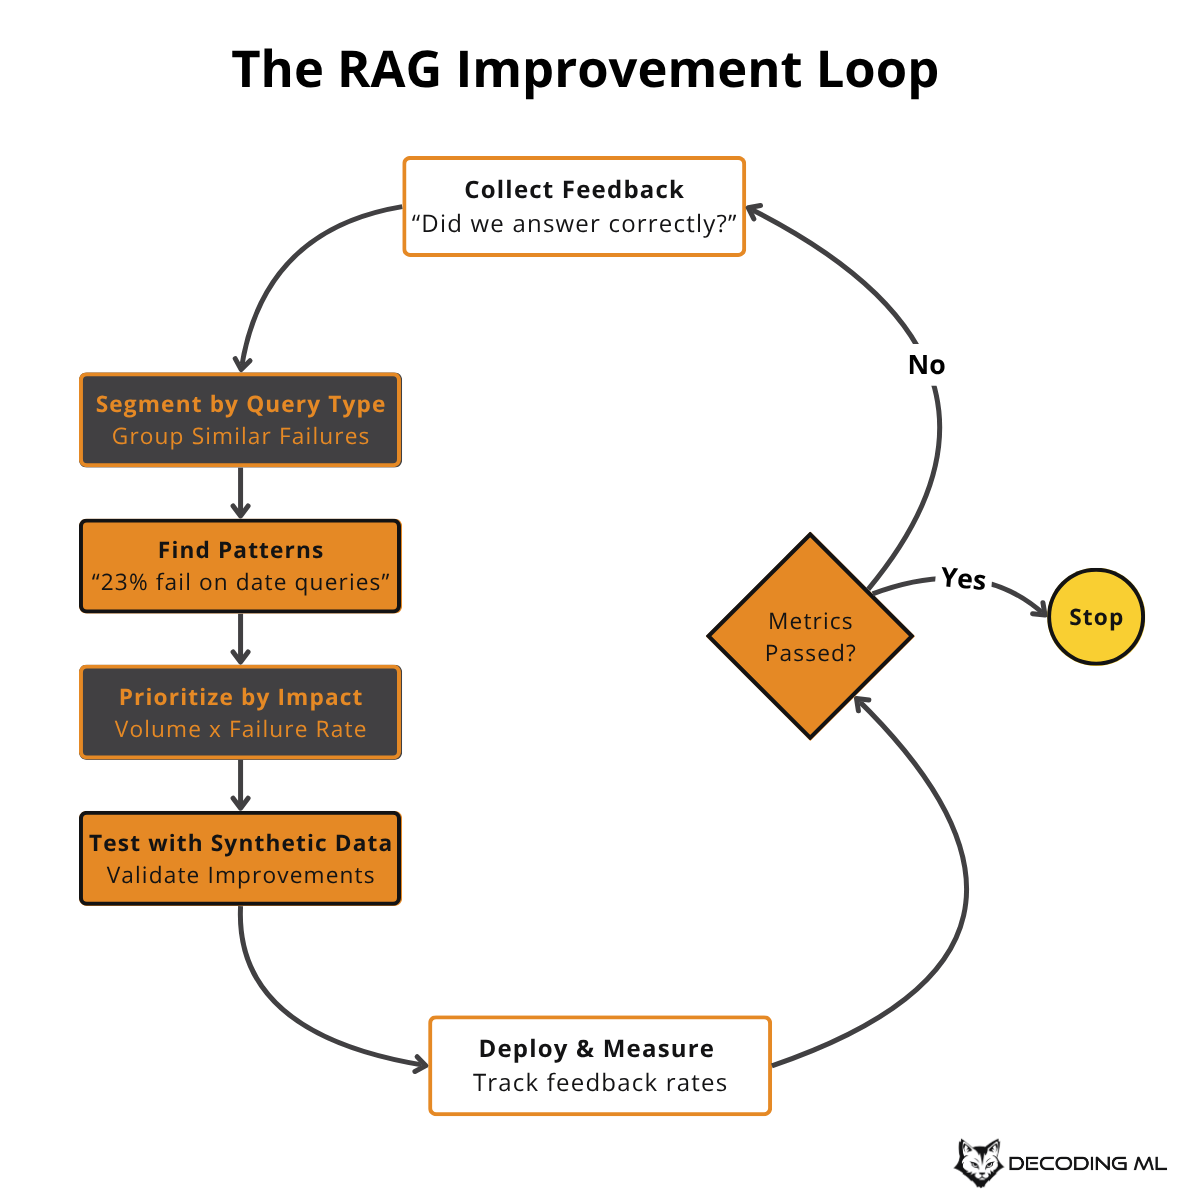
This creates a data flywheel: better feedback → better understanding → better improvements → better user experience → more feedback.
With good feedback collection, you can turn user frustrations into training data and systematic improvements rather than random guessing.
5) Cluster and Model Topics
After a few weeks of collecting feedback using the mechanisms from step 4, you'll have a new problem: success! You now have thousands of queries with ratings, but staring at individual examples won't tell you what to fix next.
The aggregate metrics lie problem: Your 70% satisfaction score might hide the fact that new users have a 20% success rate on their first query, or that your biggest customer segment is failing 80% of the time on a specific query type.
The Two Types of Problems You'll Find
There are only two reasons your RAG system fails. Once you know which one you're dealing with, the fix becomes obvious.
1. Inventory Problems: “You Don't Have What They Want” - This is like running a bookstore where someone asks for cookbooks, but you only stock mysteries. Doesn't matter how good your search is - you can't find what doesn't exist.
How to spot inventory problems:
Your retrieval returns nothing or garbage
The LLM literally says, "I cannot find information about..."
Users get desperate and try increasingly generic searches
2. Capability Problems: “You Have It But Can't Use It.” - The information exists in your system, but you can't surface it the way users need.
Example: Users asking "What's the revenue difference between Q3 and Q4?" The system had both quarters' data, but couldn't do math across documents. Users would get Q3 revenue in one response, Q4 revenue in another, then break out a calculator.
How to spot capability problems:
High retrieval scores but low satisfaction
Users rephrase the same question multiple ways
Common patterns like "compare X and Y" or "show changes since Z"
The Four-Quadrant Prioritization Framework
Once you've actually been able to run the group by, then you can do two things:
For every group, compute the percentage of the volume
Its satisfaction
Use this 2x2 matrix to prioritize your improvements:
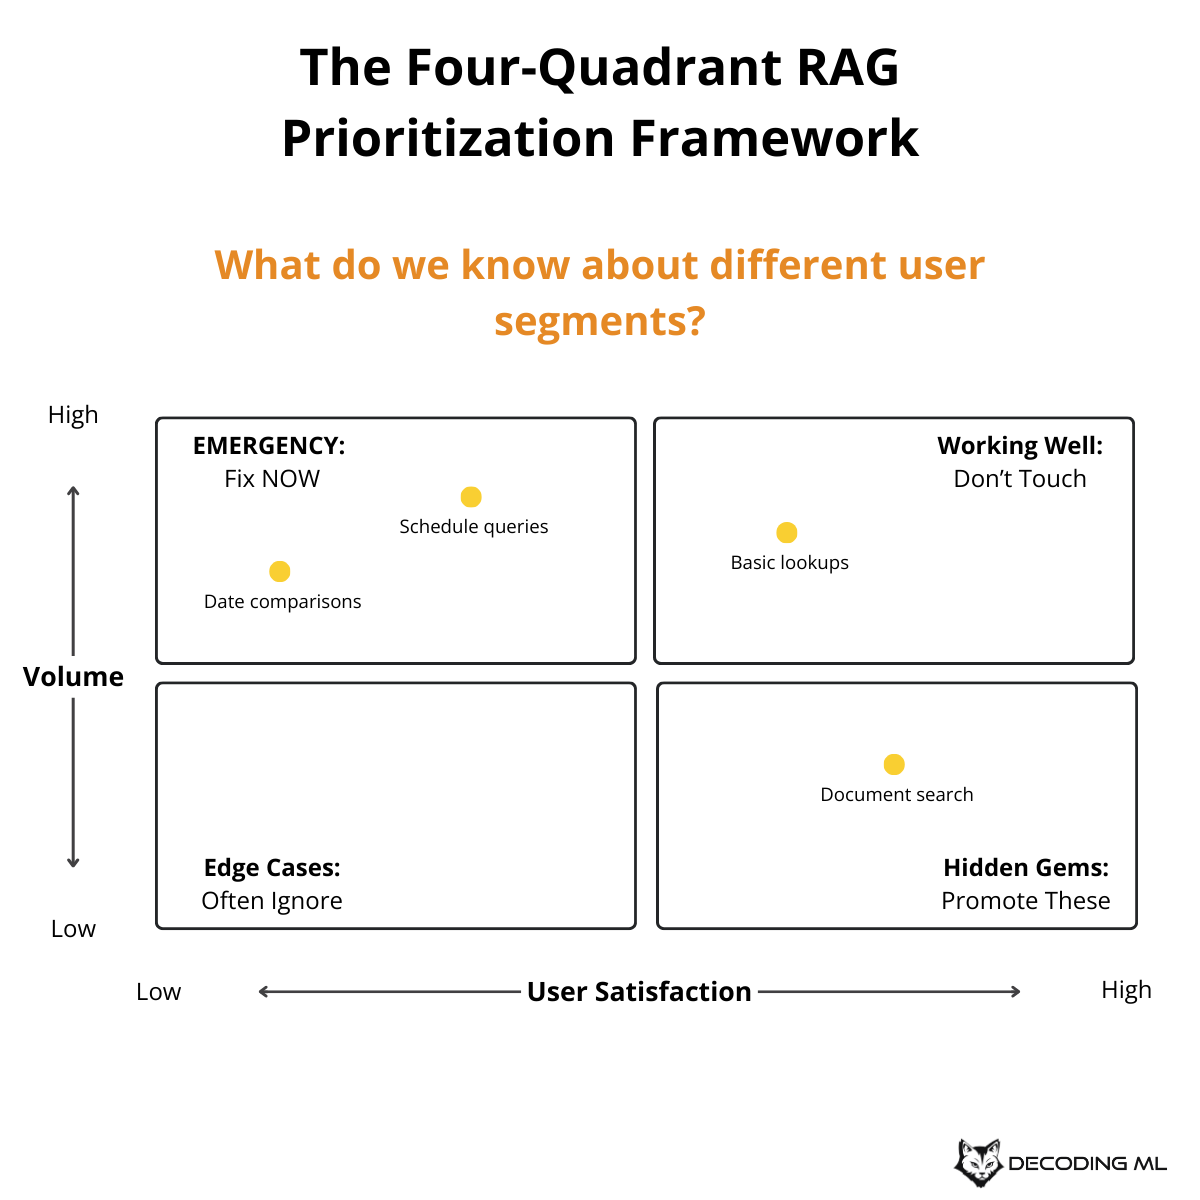
This matrix instantly shows where to focus your efforts - the bottom-right quadrant needs immediate attention.
Real-World Case Study: Legal Company
We worked with a legal company with seemingly good metrics: 70% satisfaction, growing usage. Then we segmented:
Scheduling queries: 15% volume, 35% satisfaction
Document search: 50% volume, 85% satisfaction
But 80% of new users started with scheduling queries and failed miserably. They then adapted by using document search instead. We were celebrating document search success while failing new users on their first interaction.
The Expected Value Framework
Priority = Volume × Problem Size × Business Value
At a healthcare company:
Medication side effects: 5% volume, critical for patient safety
Appointment scheduling: 30% volume, nice-to-have feature
Insurance eligibility: 15% volume, directly impacts revenue
By the numbers, appointment scheduling looked the biggest. But factoring in business value flipped the priorities completely.
Implementation: Start Simple
Step 1: Read through a few hundred queries manually. Patterns will jump out immediately.
Step 2: Use basic clustering (k-means with 20-30 clusters) on embeddings.
Step 3: Build a simple, few-shot classifier for real-time classification.
def classify_query(query, examples_by_segment):
    # Use LLM with examples to classify new queries
    return llm_classify(prompt_with_examples)
Common Capability Patterns
Temporal Capabilities (40% of failures): "Show me last week's changes", "Compare Q3 to Q4"
Comparison Capabilities: "Budget vs actual", "This year vs last year"
Aggregation Capabilities: "Total exposure across contracts", "Average by department"
From Analysis to Action
Prioritize by impact: High volume + low satisfaction = fix it now
Diagnose first: Is it inventory or capability?
Build platform capabilities: Date filtering helps 5 segments, segment-specific fixes help 1
The goal is to turn vague complaints ("search sucks") into specific, fixable problems ("date comparisons have 23% satisfaction"). This creates a flywheel: fix one segment → users trust more → they ask harder questions → you see new patterns → repeat.
6) Continuously Monitor and Experiment
Clustering from step 5 shows you what to fix, but how do you know if your fixes actually work? You need systematic monitoring that catches problems before they become user complaints.
Treat your RAG system as a living system that evolves and needs constant attention. Without systematic monitoring, you're one data distribution change away from silent degradation.
Continuous monitoring means tracking the metrics that actually matter, not just the ones that are easy to measure.
The Metrics That Reveal Problems
Most teams monitor retrieval accuracy but miss the bigger picture. Here are the metrics that actually predict user frustration:
System-Level Metrics:
Query success rate: What percentage of queries get satisfactory responses?
Topic-specific performance: How well do you handle different query types?
Failure mode distribution: What types of problems occur most often?
User Experience Metrics:
Time to useful answer: Including both latency and iteration time
Feedback conversion rate: Are users willing to give feedback?
Query refinement rate: How often do users need to rephrase?
Track Performance Drift - Monitor how your system performs as data and usage patterns change:
New customer onboarding: Do success rates drop with new user types?
Data freshness: Are you retrieving outdated information?
Model performance: Has your embedding model degraded?
Start with Vibe Checks, Scale to Metrics
🖋️ "Start with Vibe Checks, Not Just Metrics"
Start with 5-10 examples and do end-to-end vibe checks before moving to quantitative evaluation. With natural language systems, you can learn so much just from looking at a few examples. This is especially important for agent-based systems where improving individual components (like embeddings) might not improve end-to-end performance.
The most effective monitoring combines qualitative and quantitative approaches:
Manual review: Look at 10-20 recent queries weekly
Automated metrics: Run your evaluation suite on schedule
User feedback analysis: Check feedback trends and cluster performance
A/B testing: Test improvements on real traffic
Experimenting Without Breaking Things
When you find problems, resist the urge to make big changes. Use the systematic approach:
Isolate the issue: Which specific query types or clusters are failing?
Test on synthetic data: Will your fix actually help?
A/B test carefully: Deploy to a small percentage of traffic first
Measure systematically: Use the same metrics from your baseline
This creates a continuous improvement loop: monitor → identify problems → test solutions → deploy improvements → monitor again.
The goal is to make your system antifragile—it gets stronger from the stress of real user queries rather than breaking down over time.
7) Balance Latency and Performance
Your monitoring from step 6 will reveal opportunities for improvement, but each enhancement comes with trade-offs. The final piece of systematic RAG improvement is making these decisions based on data rather than instinct.
The key insight: Use your synthetic data from step 1 to quantify trade-offs before you feel the pain in production.
The Three-Step Trade-Off Framework
1. Establish Your Baseline Measure your current recall, latency, and cost per query. These become your comparison points for any improvement.
2. Test Each Improvement For every potential enhancement, measure the impact on all three metrics - both with and without the feature enabled. Never assume a change only affects one dimension.
3. Apply Your Business Context Different use cases have different tolerances for trade-offs:
Real-World Trade-Off Examples
Parent Document Retrieval: Retrieving larger context around matched chunks improves recall by 15% but increases latency by 40%. Worth it for legal research, not for customer support.
Re-ranking Layer: Adding a neural re-ranker after vector search improves recall by 8% but increases latency by 200%. Only deploy for high-stakes research where accuracy matters more than speed.
Hybrid Search: Combining vector + full-text search improves recall by 12% with only 25% latency increase. Good trade-off ratio for most use cases.
Decision Documentation That Actually Helps
Document your trade-off decisions with the reasoning and metrics that drove them. Include:
What improvement was tested
Specific performance impact (15% better recall, 40% higher latency)
Business context that drove the decision
When to re-evaluate the decision
Example: "Enabled parent document retrieval because legal use case requires high recall. Recall improved 15%, latency increased 40%. Worth it for this domain. Review quarterly as infrastructure improves."
Making Smart Trade-Offs Over Time
The Business Context Matters Most: A 1% recall improvement might be critical for medical diagnosis but meaningless for general documentation search.
Infrastructure Changes the Game: What's too slow today might be acceptable next year. Re-evaluate disabled features quarterly as your infrastructure improves.
User Behavior Evolves: As users trust your system more (thanks to improvements from steps 1-6), they'll ask more complex questions that might justify different trade-offs.
💬 "Agentic Systems Change the Equation"
In agentic systems, the trade-offs shift. Agents are persistent - they'll eventually find what they need even with suboptimal tools. This means you might accept higher latency for better end-to-end outcomes, since agents can iterate and course-correct.
Focus on making informed decisions that align with what your users actually need, backed by data from your systematic approach.
Wrapping Up: Your RAG Improvement Journey
I've spent over a decade building AI systems at Facebook, Stitch Fix, and consulting for companies funded by Sequoia, a16z, and Y Combinator across construction, CRM, financial services, and personal assistants — from recommendation systems that drove $50M in revenue to content safety systems processing millions of items.
This systematic approach has been refined through countless implementations and has been so successful that engineers at companies like Anthropic, OpenAI, Google, Microsoft, PwC, Bain & Company, Booz Allen Hamilton, and hundreds of other leading organizations take my course to get caught up as they learn AI engineering.
While many implementation details have been simplified here, the key is to start measuring and iterating rather than guessing.
If you're looking for a more detailed live cohort course, consider enrolling in our 6-week Systematically Improving RAG Applications masterclass.
Think of it as having a technical lead for six weeks as we improve your RAG pipeline.
Here’s what you’ll get over the 6 weeks of the Systematically Improving RAG Applications course:
6 hours of training material, organized in the best order for learning and applying each concept
12 hours of office hours with me, where you can ask questions about the material or your own projects
6 hours of guest speakers, including practitioners and researchers sharing real-world insights
$2,000 in credits from top companies, so you can try out tools and services like:
Cohere (for rerankers)
Google (for Gemini long context models)
Modal Labs (for fine-tuning models with GPUs)
Pydantic and Braintrust (for observability)
Llama Index and Reducto (for PDF parsing)
LanceDB and ChromaDB (for vector databases)
+ more are being added regularly
You’ll also get access to a private GitHub repository with:
12 optional Jupyter notebooks
Complete, structured notes for every lecture, guest speaker, and office hour
Easy setup: just clone the repo and open it in Cursor to get a private teaching assistant for the course
Plus, you’ll have access to our Slack channel for async questions and support throughout the course.
The next cohort starts on September 16 (use affiliate code PAULxMAVEN for $100 off). Find more on Maven ↓
Not ready for the masterclass?
For a deeper dive into these concepts, check out the free 6-week email course on RAG that covers all these strategies in detail:
Images
If not otherwise stated, all images are created by the author.
 | A guest post by
|
Pure Gold! 🔥
Fantastic article, Jason. Thanks for contributing to Decoding ML with it!